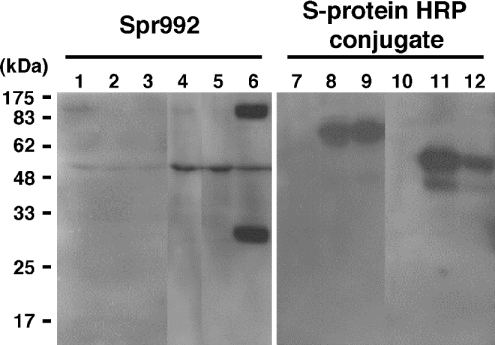
Figure 2. Representative Western blots showing the expression of MT-SP1wt or sHAI-1 expressed in COS-1 cells and the activation of MT-SP1wt by co-expression with sHAI-1.
Transfection was performed when cells cultured on 100 mm dishes reached approx. 90% confluence. Samples were prepared as described in the Experimental section. All samples were separated by SDS/PAGE (12% polyacrylamide) under reducing conditions; Western blots were probed with Spr992 (lanes 1–6) or HRP-conjugated S-protein (lanes 7–12). Lanes 1 and 7, crude membranes from cells transfected with pcMT-SP1wt (12.5 μg) and pSecTagHygro vector (12.5 μg); lanes 2 and 8, crude membranes from cells transfected with pSecHAI-1 (12.5 μg) and pcDNA3.1(+) vector (12.5 μg); lanes 3 and 9, crude membranes from cells transfected with pcMT-SP1wt (12.5 μg)+pSecHAI-1 (12.5 μg); lanes 4 and 10, conditioned media of cells transfected with pcMT-SP1wt (12.5 μg) and pSecTagHygro vector (12.5 μg); lanes 5 and 11, conditioned media of cells transfected with pSecHAI-1 (12.5 μg) and pcDNA3.1(+) vector (12.5 μg); lanes 6 and 12, conditioned media of cells transfected with pcMT-SP1wt (12.5 μg)+pSecHAI-1 (12.5 μg). The 28 kDa band, which represents the catalytic domain of MT-SP1/matriptase after activation cleavage, is apparent in lane 6 but not in lane 3. A protein with a mass of approx. 50 kDa visible in lanes 1–6 is a non-specific band representing an unknown protein. The molecular-mass standards are indicated on the left in kDa.

