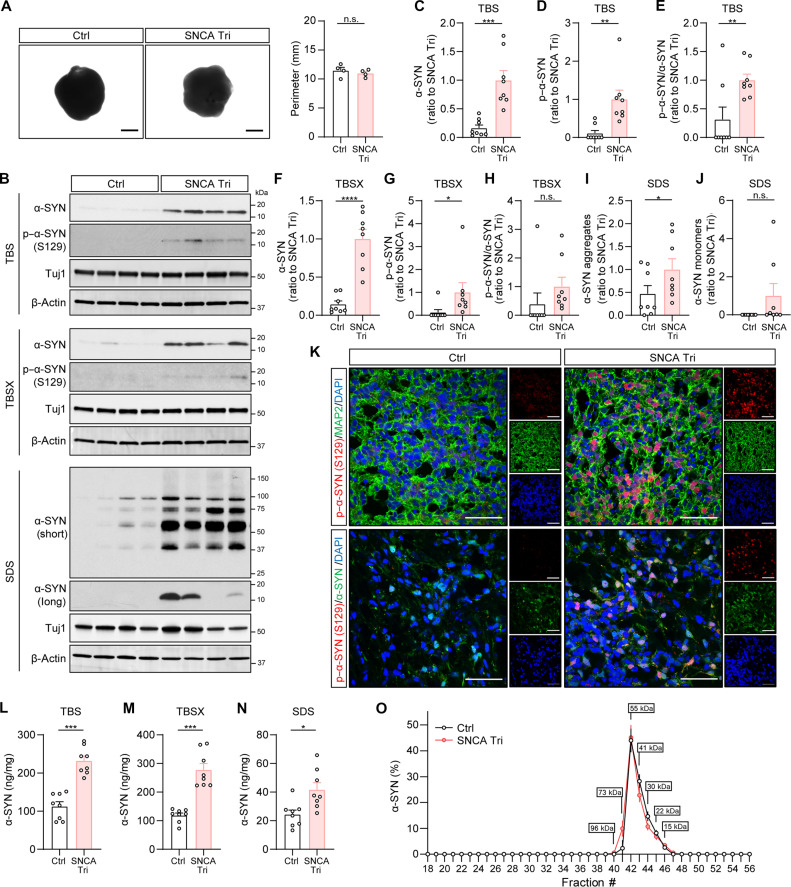
Fig. 1. Increased levels of α-SYN in the iPSC-derived SNCA triplication cortical organoids.
(A) Representative images showing the size of organoids. The perimeters of the organoids were measured and compared. Each dot on the graph represents the average perimeter of approximately 96 organoids per condition. n = 4 samples per group. Scale bar, 1 mm. (B to J) The levels of total α-SYN and phosphorylated α-SYN in each fraction of organoids were measured using Western blotting. Different exposure times (short and long) were applied to display and quantify the aggregated and monomeric α-SYN. Results were normalized to Tuj1 levels. n = 4 samples with two replicates per group. Each dot on the graph represents an individual replicate. Molecular weight markers (kilodaltons) are indicated on the right side of each blot. (K) The Ctrl and SNCA Tri organoids were immunostained with phosphorylated–α-SYN (S129) antibody (red) and MAP2 antibody (green, top) or total α-SYN (green, bottom). The nuclei were stained with 4′,6-diamidino-2-phenylindole (DAPI) (blue). Scale bar, 50 μm. (L to N) The levels of total α-SYN in each fraction of organoids were measured using ELISA. The experiments were conducted in duplicate. n = 4 samples. Each dot on the graph represents an individual replicate. (O) TBS-soluble organoid lysates were fractioned using SEC. The fractions ranging from #18 to #56 were collected, and the levels of α-SYN were measured using ELISA. The experiments were performed in duplicate. n = 4 samples per group. Data represent means ± SEM. Student’s t tests were used for statistical analyses. *P < 0.05; **P < 0.01; ***P < 0.001; n.s., not significant.

