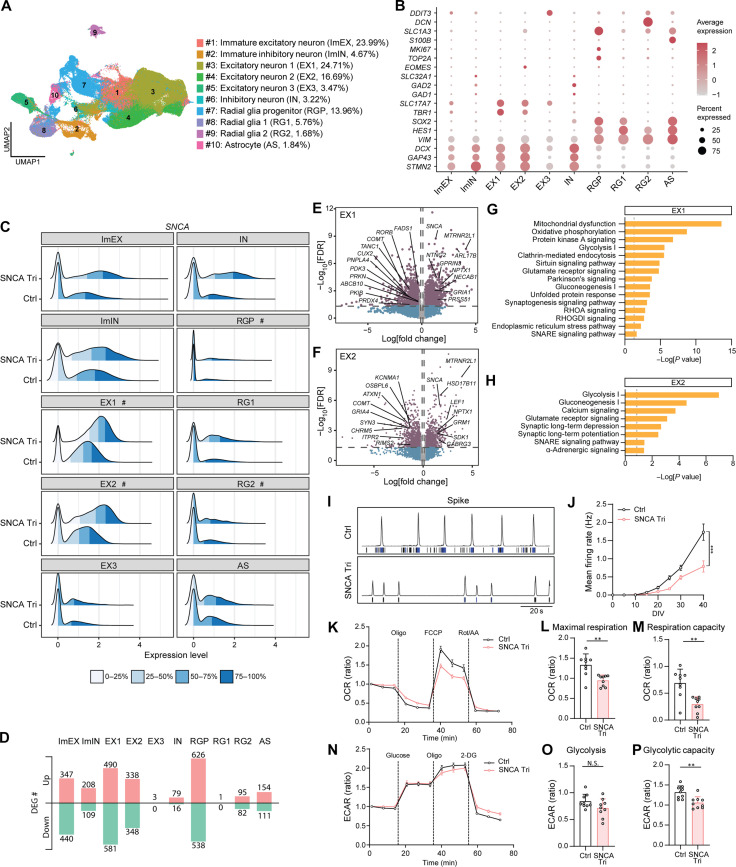
Fig. 2. Dysregulation of crucial pathways in SNCA triplication organoids revealed by scRNA-seq analysis with functional validation.
(A) UMAP plot of Ctrl and SNCA Tri organoids. The average cell population of each cluster is shown. Experiments were performed in three replicates per sample with n = 4 samples per group. A total of 161,920 cells were analyzed. (B) Dot plots of known marker genes. (C) Ridge plot of SNCA expression in each cell types. “#” indicates clusters showing significant difference. (D) Number of DEGs for each cell cluster. Up/Down, up-regulated/ down-regulated genes. (E and F) Volcano plots for DEGs in the EX1 (E) and EX2 (F) clusters. (G and H) Selected canonical pathways enriched by DEGs from the EX1 (G) and EX2 (H) clusters. (I and J) MEA assay. Representative spike histogram with a raster plot of electrode activity (I) and mean firing rate (J) are shown. Experiments were conducted in quadruplicate with three independent experiments. Data are presented as means ± SEM. Two-way repeated measures analysis of variance (ANOVA) was used for statistical analyses. (K to P) Seahorse XF Mito Stress test (K to M) measuring OCR (K), and maximum respiration (L) and respiratory capacity (M). Seahorse XF Glycolysis Stress test (N to P) measuring ECAR (N), glycolysis level (O), and glycolytic capacity (P). Each data point was normalized to the first data point to calculate the OCR or ECAR ratio. Experiments were conducted in triplicate with three independent experiments. Each dot represents an individual replicate, and the data are presented as means ± SEM. Student’s t tests were used for statistical analyses. *P < 0.05; **P < 0.01; ***P < 0.001.

