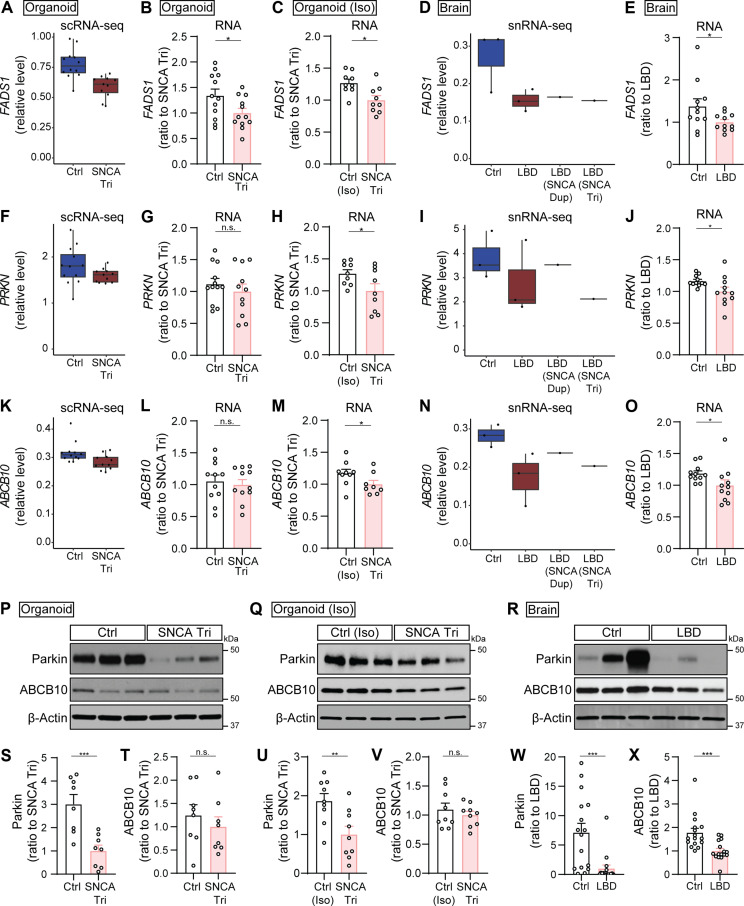
Fig. 4. Validation of overlapping DEGs between cortical organoids and human brains.
Validation of the overlapping DEGs through qPCR (A to O) and Western blotting (P to X) in control and SNCA triplication organoids (labeled as Organoid; B, G, L, P, S, and T), isogenic set of control (Iso) and SNCA triplication organoids [labeled as Organoid (Iso); C, H, M, Q, U, and V], and human brains (labeled as Brain; E, J, O, R, W, and X). (A to O) RNA levels of FADS1 (A to E), PRKN (F to J), and ABCB10 (K to O) genes. Box plots illustrate their RNA levels in the EX1 cluster of organoids (A, F, and K), and in the EX cluster of human brains (D, I, and N). Bar graphs present the RNA levels in organoids (B, G, and L), isogenic organoids (C, H, and M), and human brains (E, J, and O). (P to X) Parkin and ABCB10 levels. Representative gel images and quantification of Parkin and ABCB10 levels in TBSX fractions of organoids (P, S, and T), isogenic organoids (Q, U, and V), and human brains (R, W, and X). Results were normalized to β-actin levels. Organoids: n = 4 samples with three replicates (qPCR) or two replicates (Western blotting) per group; each dot on the graph represents an individual replicate. Isogenic organoids: The experiments were conducted in triplicate with three independent experiments. Each dot on the graph represents an individual replicate. Human brains: n = 11 samples (qPCR) or n = 16 samples (Western blotting) per groups; each dot on the graph represents an individual case. Data represent means ± SEM. Student’s t tests were used for statistical analyses. *P < 0.05; **P < 0.01; ***P < 0.001.

