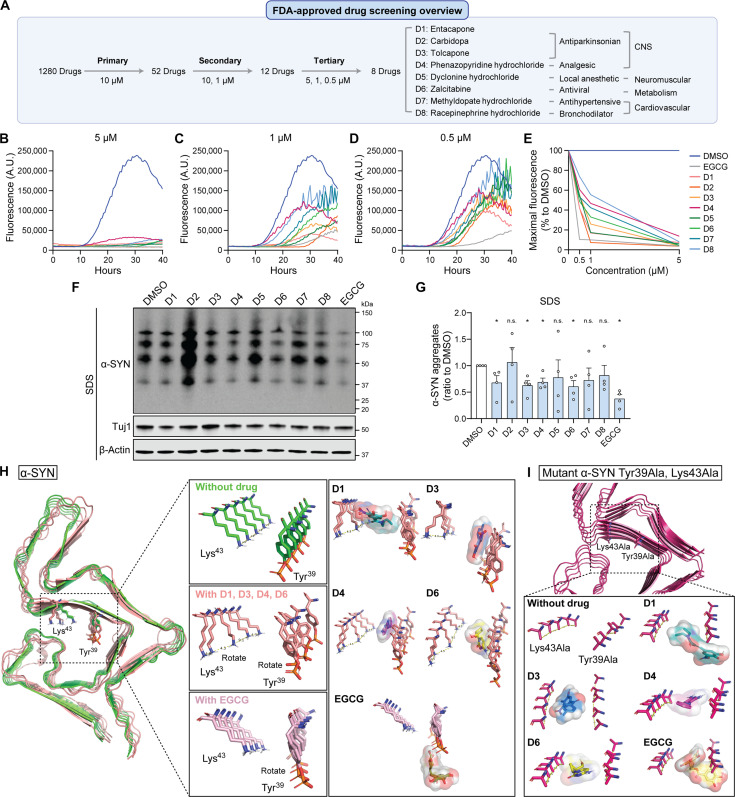
Fig. 5. Identification of FDA-approved drug candidates inhibiting α-SYN seeding and aggregation.
(A to E) Overview of FDA-approved drug screening at various concentrations to discover α-SYN aggregation inhibitors using RT-QuIC assay (A). Final eight selected drugs (D1 to D8) are listed with their original function. The aggregation curves at different concentrations (B to D) and the percentage reduction in maximal fluorescence induced by drug treatment at different concentrations (E) are shown. Negative (DMSO) and positive (EGCG) controls were included. Data represent mean values of duplicate experiments. FCCP, carbonyl cyanide p-trifluoromethoxyphenylhydrazone. (F and G) The drug-treated SNCA Tri organoids were lysed in RIPA and SDS buffers sequentially, and the levels of total α-SYN in the SDS fractions were measured by Western blot. DMSO and EGCG were used as controls. Four independent experiments were conducted, and data are presented as means ± SEM. Student’s t tests were used for statistical analyses by comparing each group with DMSO-treated group. 2-DG, 2-deoxyglucose. (H) The computational 3D drug-working model depicting the binding interactions between α-SYN aggregates and the drug candidates (D1, D3, D4, and D6) and EGCG at the Tyr39 and Lys43 residues. The α-SYN aggregate conformation without the drug is visualized in green, while the conformation with the drug bound is presented in pink. Representative images of α-SYN aggregate conformations, both with and without the D1 or EGCG drug, are shown to illustrate the working model at the Tyr39 and Lys43 residue sites. (I) The computational 3D model showing the drug’s effect was generated for mutated α-SYN, where Tyr39 and Lys43 were replaced with alanine (Tyr39Ala and Lys43Ala). The mutated α-SYN aggregate with and without drug is visualized in magenta.

