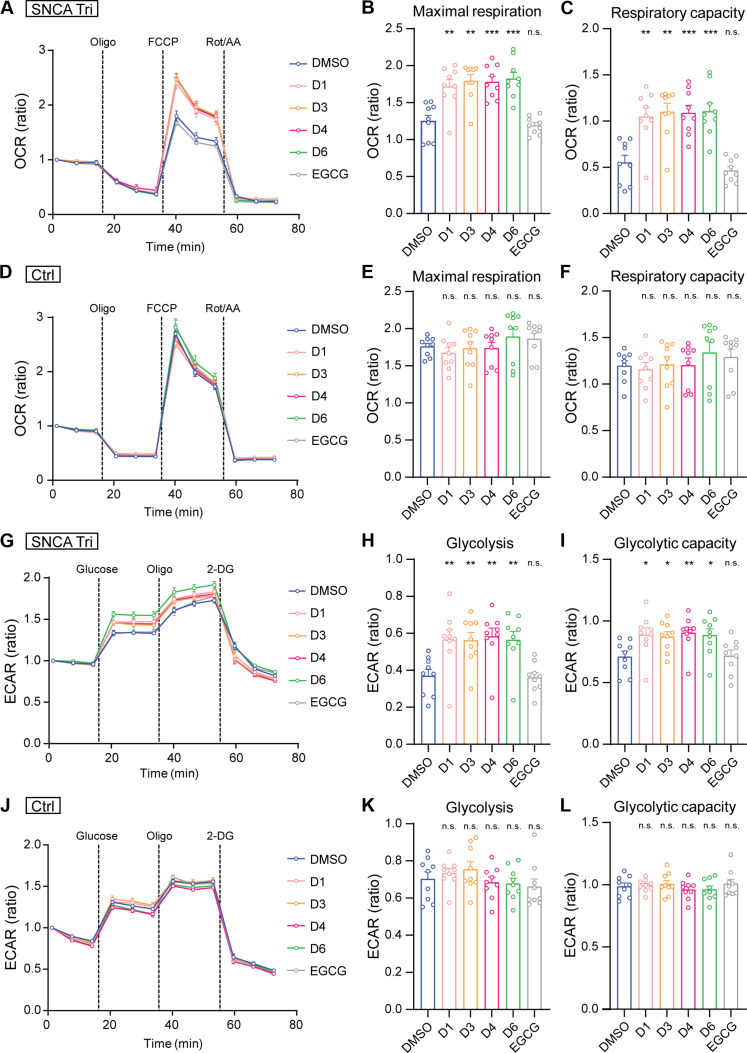
Fig. 6. Effects of drug treatment on alleviating mitochondrial dysfunction in SNCA triplication iPSC-derived models.
(A to L) SNCA Tri and Ctrl neurons were treated with the final four drug candidates (D1, D3, D4, and D6) at 0.5 μM from DIV7. Seahorse assay was performed at DIV20. Seahorse XF Mito Stress test (A to F) measured OCR, comparing DMSO- to drug-treated SNCA Tri and Ctrl neurons. Maximum respiration (B and E) and respiratory capacity (C and F) were analyzed. Seahorse XF Glycolysis Stress test (G to L) measured ECAR, comparing DMSO- and drug-treated neurons. Glycolysis level (H and K) and glycolytic capacity (I and L) were determined. EGCG was used as a reference. Each data point was normalized to the first data point to calculate the OCR or ECAR ratio. Three independent experiments were conducted in triplicate, and each dot represents an individual replicate. Data are shown as means ± SEM. Student’s t tests were used for statistical analyses by comparing each group with DMSO-treated group. *P < 0.05; **P < 0.01; ***P < 0.001.

