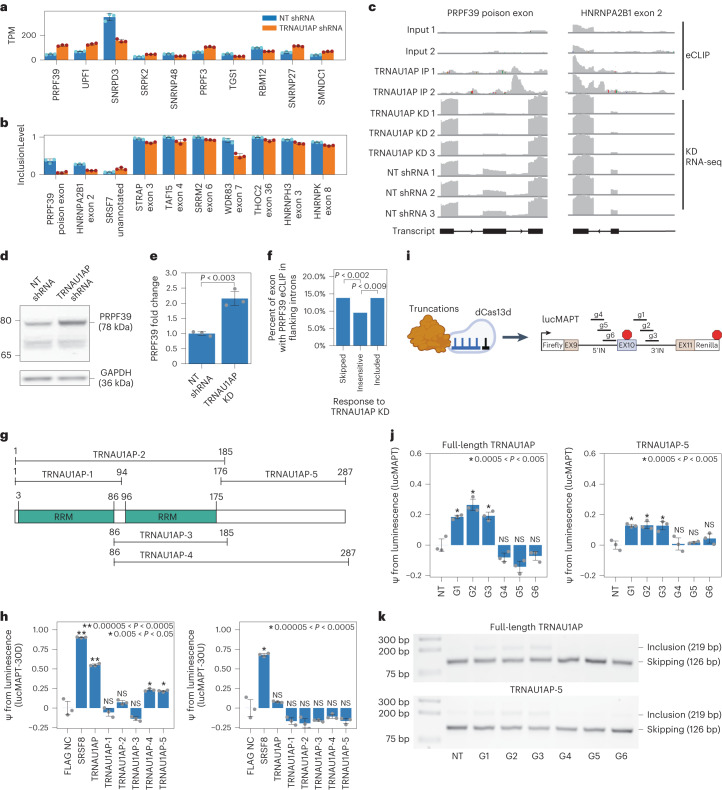
Fig. 5. TRNAU1AP participates in splicing co-regulatory networks and activates exon inclusion through a C-terminal effector domain.
a, Bar graph showing relative expression level of the top 10 differentially expressed splicing-associated genes as sorted by DeSeq2-determined adjusted P value after TRNAU1AP knockdown (mean ± s.d., n = 3 replicate transductions). b, Bar graph showing relative exon inclusion level of the top 10 differentially spliced skipped exon events in splicing-associated genes as sorted by rMATS-determined adjusted P value after TRNAU1AP knockdown (mean ± s.d., n = 3 replicate transductions). c, IGV browser tracks showing coverage of TRNAU1AP eCLIP signal relative to size-matched input and TRNAU1AP knockdown RNA-seq signal relative to non-targeting shRNA at a poison exon in PRPF39 and exon 2 of HNRNPA2B1. d, Representative western blot showing increased PRPF39 expression in HEK293T cells after TRNAU1AP knockdown. GAPDH is the loading control. e, Bar graph showing fold change of PRPF39 expression as quantified by western blot after TRNAU1AP knockdown (mean ± s.d., n = 3 replicate transfections). P = 0.0024 by two-tailed independent two-sample t-test. f, Bar plot displaying percentage of exons containing PRPF39 reproducible enriched eCLIP windows in flanking introns from ENCODE HepG2 data, separated by exon sensitivity to TRNAU1AP knockdown in HEK293T cells. P values are calculated using the two-sided chi-squared test. P = 0.0011 for PRPF39 binding to exons skipped after TRNAU1AP knockdown and 0.0088 for exons included after TRNAU1AP knockdown. g, Domain structure of TRNAU1AP with truncations used for effector domain identification. h, Bar graphs displaying reporter readout from both lucMAPT-30U and lucMAPT-30U co-transfected with MCP-fused truncations (mean ± s.d., n = 3 replicate transfections). P value was calculated by one-tailed independent two-sample t-test. NS, not significant (P > 0.05). i, Schematic of truncation–dCas13d fusions used as for MS2-free tests. Schematic of MS2-free lucMAPT reporter used and associated guide RNAs. j,k, Reporter readouts from co-transfection of the MS2-free lucMAPT reporter, either full-length TRNAU1AP–dCas13d fusion or truncated TRNAU1AP-5–dCas13d fusion, and each guide RNA annotated in i. j, Bar graph showing PSI calculated from luminescence (mean ± s.d., n = 3 replicate transfections). P value was calculated by one-tailed independent two-sample t-test. NS, not significant (P > 0.05). k, Splicing gels displaying lucMAPT AS. bp, base pairs; KD, knockdown.

