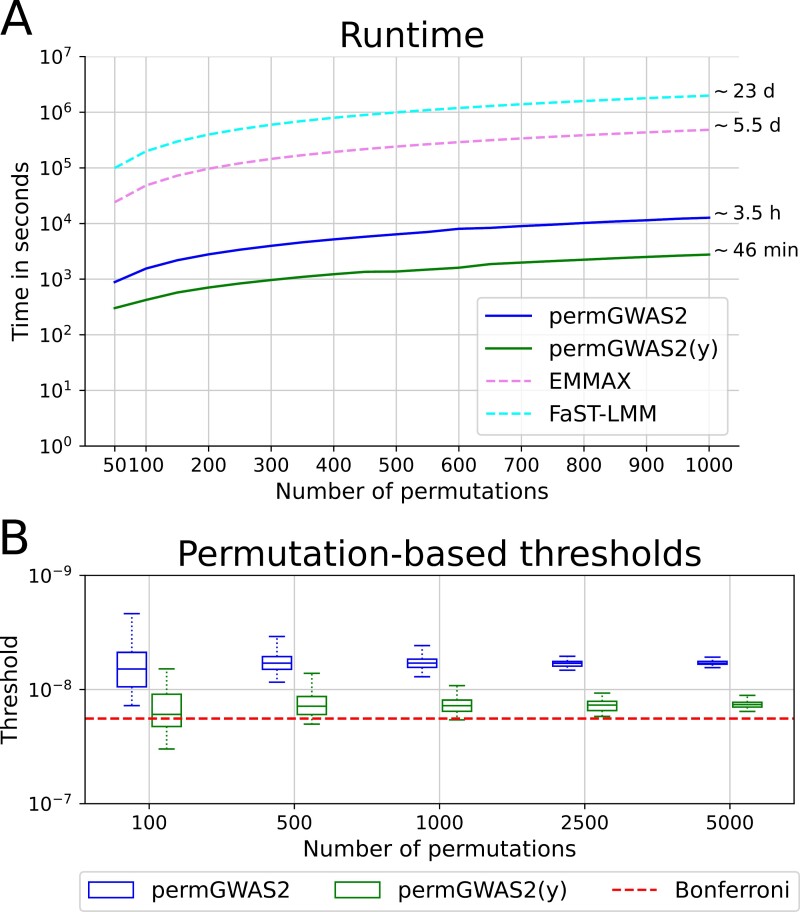
Fig. 2.
Comparison of runtime and permutation-based thresholds of permGWAS2 and permGWAS2(y) based on the number of permutations. (A) Computational time as a function of the number of permutations with fixed 1000 samples and 1 million single nucleotide polymorphisms (SNPs). Dashed lines for EMMAX and FaST-LMM are estimated based on the runtime for 1000 samples and 1 million markers times the number of permutations. (B) Permutation-based thresholds for different numbers of permutations on an inverted logarithmic axis. Thresholds were computed 50 times for the same phenotype. The static Bonferroni threshold is shown as a red dashed line.

