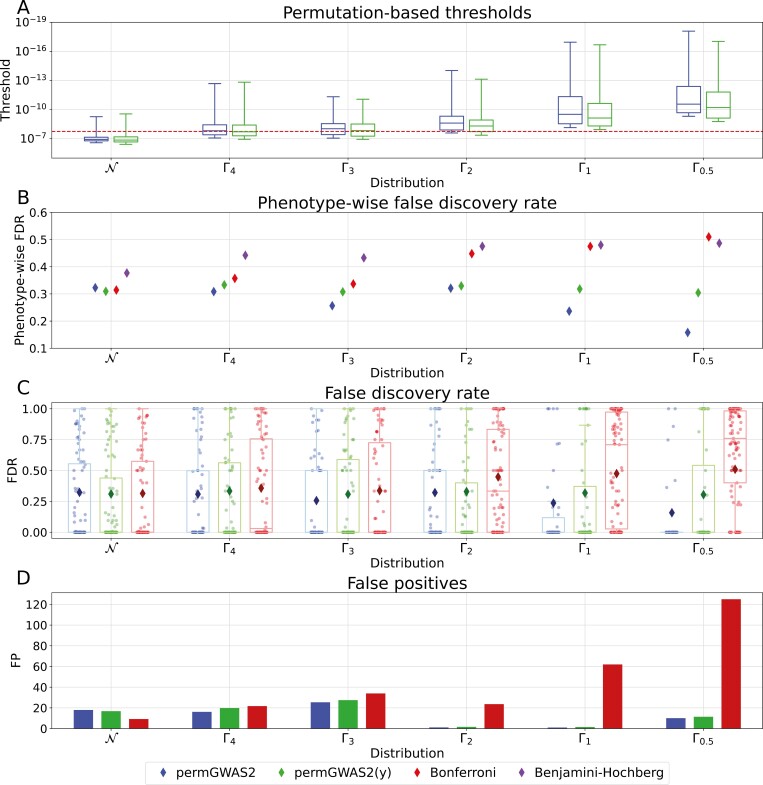
Fig. 3.
Comparison of permGWAS2 and permGWAS2(y) with Bonferroni threshold on simulated data with normally () or gamma-distributed noise with different shape parameters (Γ4, …, Γ0.5). (A) Permutation-based thresholds over 100 simulations as box plots for each distribution. Red dashed line shows the static Bonferroni threshold. (B) Phenotype-wise false discovery rate (FDR) for permutation-based thresholds, Bonferroni, and Benjamini–Hochberg significance threshold. (C) FDR for each simulation as strip plots. Box plots visualize the overall distribution and diamonds represent the corresponding phenotype-wise FDR. (D) Average number of false positives over 100 simulations per distribution.

