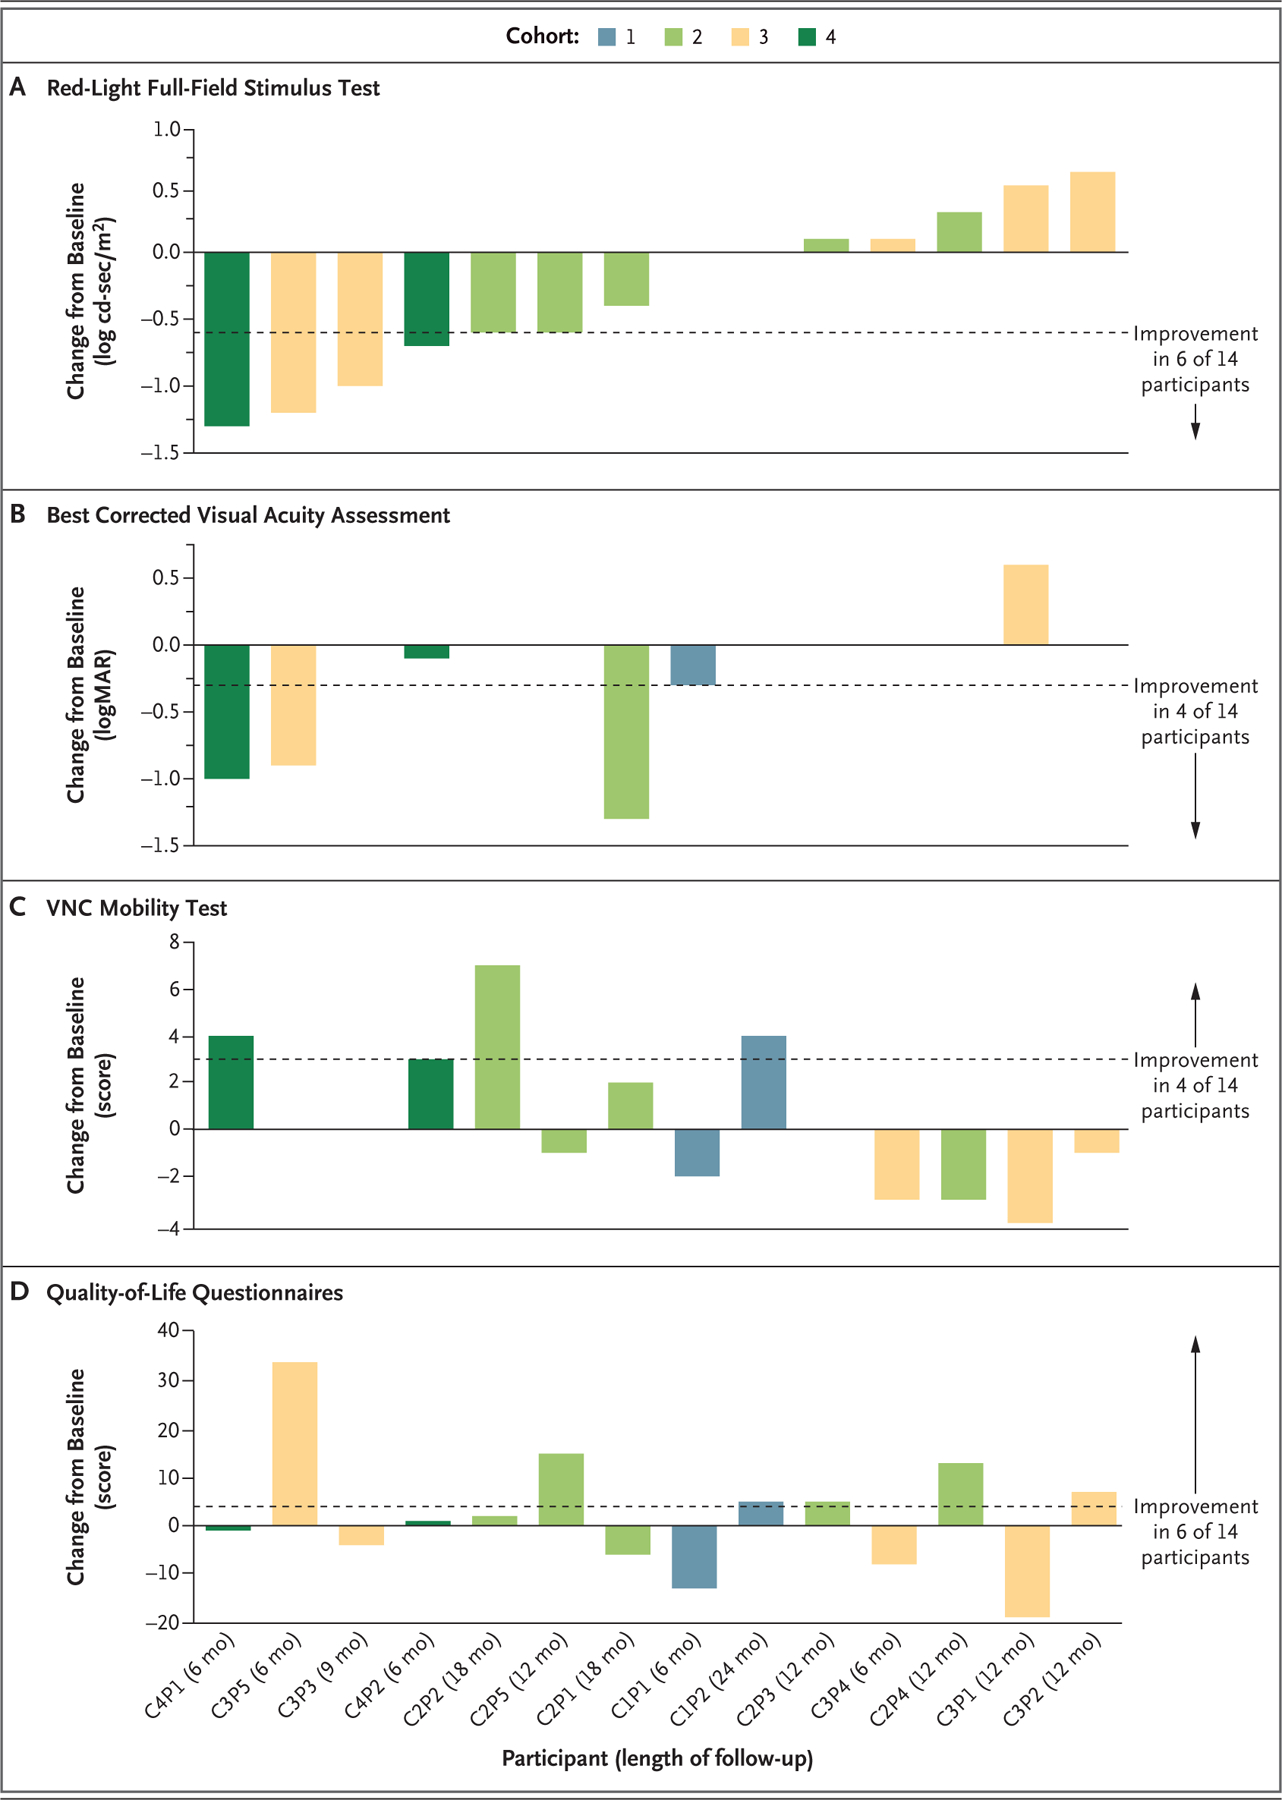
Figure 1. Change from Baseline in Key Efficacy Outcomes.

Changes from baseline to the latest follow-up assessment in the sensitivity to red light as measured with full-field stimulus testing (Panel A), the best corrected visual acuity (Panel B), the score on the Ora–Visual Navigation Challenge (VNC) mobility test (Panel C), and the vision-related quality-of-life score on the National Eye Institute Visual Function Questionnaire–25 (for adults) or the Children’s Visual Function Questionnaire (for children) (Panel D) are shown for 14 participants who received EDIT-101 gene-editing therapy and had a follow-up duration of at least 6 months. Cohort 1 comprised adults who received a low dose (6×10¹¹ vector genomes [vg] per milliliter) of EDIT-101 in the worse (study) eye; cohort 2, adults who received an intermediate dose (1×10¹² vg per milliliter); cohort 3, adults who received a high dose (3×10¹² vg per milliliter); and cohort 4, children who received the intermediate dose. The contralateral (control) eye was untreated. Improvements in the full-field red light–sensitivity threshold and the best corrected visual acuity are shown as negative values, and improvements in the score on the VNC mobility test and the score on the vision-related quality-of-life questionnaires are shown as positive values. The dashed lines indicate the thresholds for meaningful improvement. The direction of improvement and the number of participants with improvement for each metric are indicated to the right of each panel. Participant identifiers (defined according to cohort [C] number and participant [P] number) and lengths of follow-up are shown on the x axis. Data from the red-light full-field stimulus test for Participant C1P2 were not available. logMAR denotes log10 of the minimum angle of resolution.
