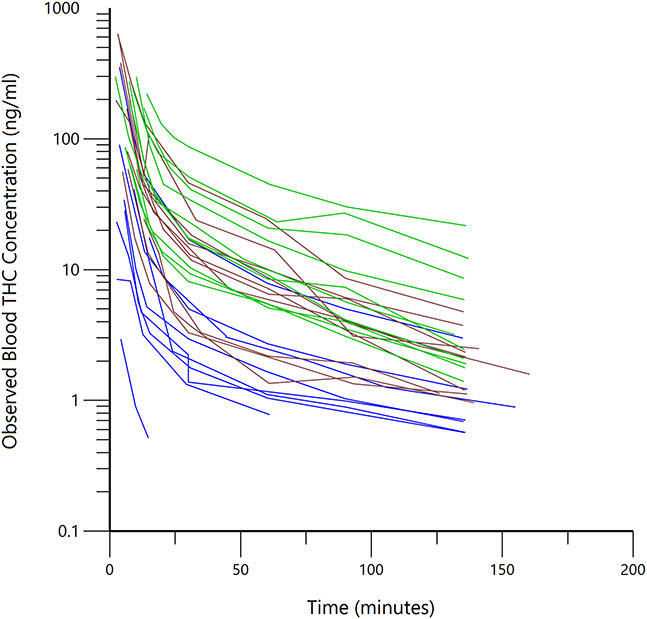
FIGURE 1.

Observed blood THC concentration versus time, beginning with the first postinhalation blood sample, for all 29 subjects (each line connects the measured concentrations from one subject) after subtraction of the baseline (before inhalation) blood THC concentration. Blue lines are occasional flower users, brown lines are daily concentrate users, and green lines are daily flower users.
