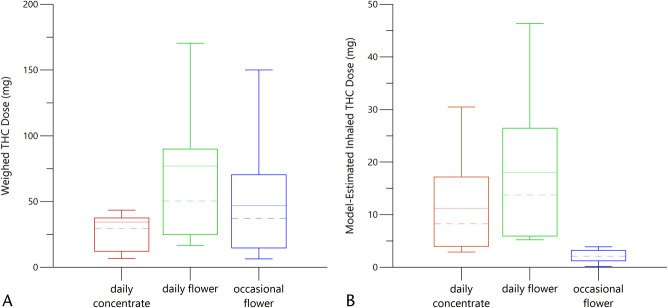
FIGURE 3.
A, Box plots of weighed THC doses with colors coded to match Figure 1. The dashed lines are the median values; the solid lines are the mean values. The ends of the “box” are the 25th and 75th percentiles. The whiskers show the lowest data value still within 1.5 IQR of the lower quartile and the highest value within 1.5 IQR of the upper quartile, whereas IQR is the interquartile range. B, Box plots of model-estimated inhaled THC doses with colors coded to match Figure 1. The dashed lines are median values; the solid lines are mean values. The ends of the “box” are the 25th and 75th percentiles. The whiskers show the lowest data value still within 1.5 IQR of the lower quartile and the highest value within 1.5 IQR of the upper quartile, whereas IQR is the interquartile range.

