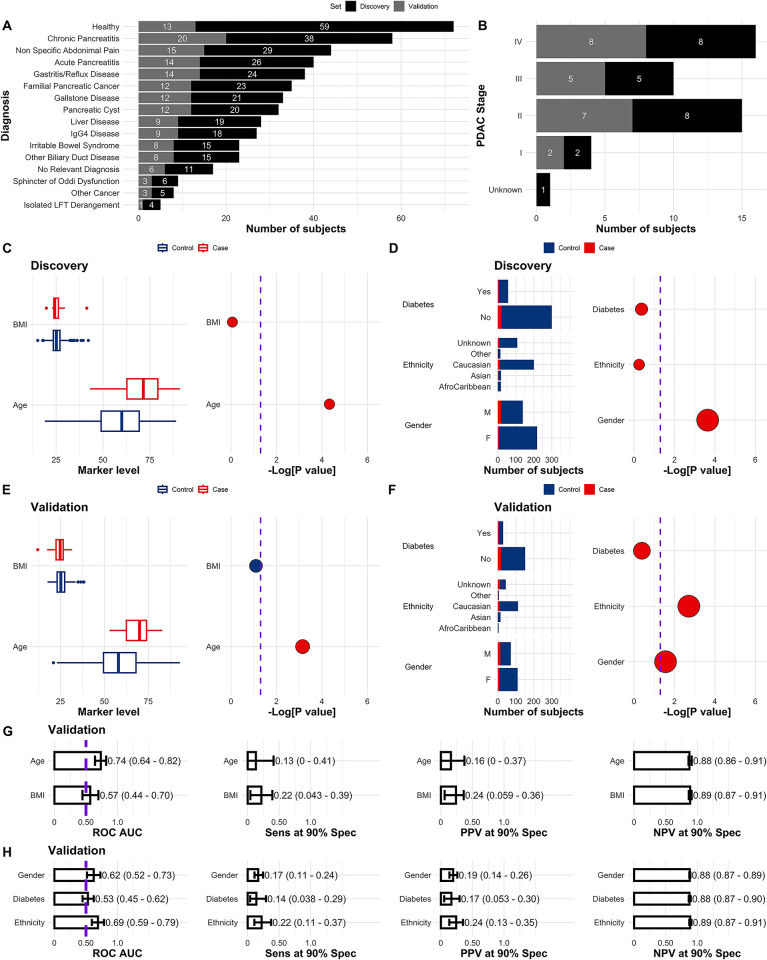
Fig 1. Characteristics of the discovery and validation sets.
Number of controls across the discovery and validation sets (A), number of PDAC cases per stage (B), and association of BMI, Age, Diabetes, Ethnicity and Gender with PDAC status (C-F). In C, D, E and F dot sizes correspond to odds ratios and are colour coded according to their respective values, i.e., blue if OR<1 and red if OR>1. p values were calculated according to a logistic regression model with a bias reduction method. Purple dashed lines correspond to -Log[0.05]. G Receiver Operating Characteristic (ROC) Area Under the Curve (AUC), Sensitivity (Sens), Positive Predictive Value (PPV) and Negative Predictive Value (NPV) at 90% Specificity (Spec) performance of single marker models, i.e. BMI and Age, in the validation set. H Similar to A but for Gender, Ethnicity and Diabetes. Performances were calculated with the respective single feature models developed in the discovery set. The ROC AUC significance threshold is also represented by a purple dashed line at 0.5. Error bars in figures corresponding to the validation set are the 95% Confidence Intervals (CI), calculated by stratified bootstrapping 2000 times. See Statistical Analysis in Materials and methods for further details and Tables A, B and N in S1 Appendix.

