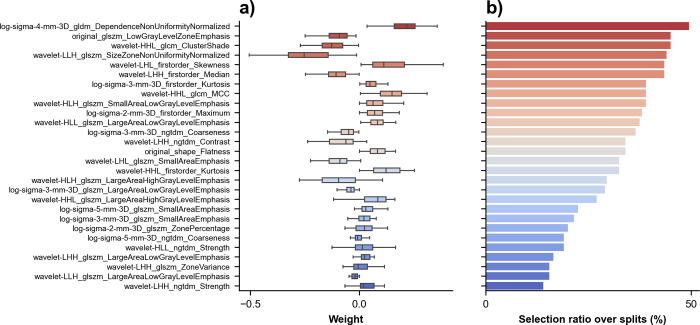
Fig 8. Radiomics signature coefficients for prediction of recurrence.
(A) Box plot shows selected features coefficients sorted by descending order of selection ratio over splits. (B) Count plot of radiomics signature coefficients selections over the splits for the aggregation the radiomics signature coefficients with the aggregation ‘largest lesion only’.

