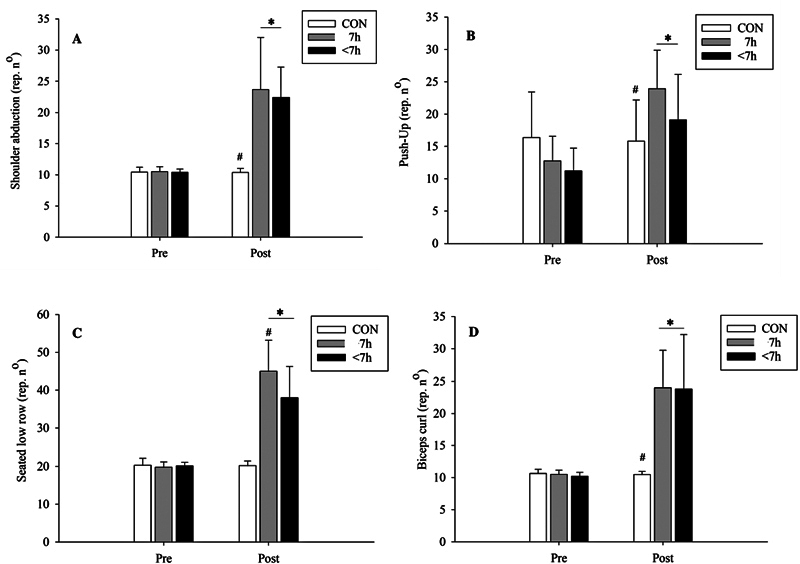
Fig. 2.

Mean and standard deviation of maximal repetition number. (A) Shoulder abduction pre- and post-training among groups (CON= control group; 7h= Group that sleeps 7 hours; <7h= Group that sleeps less than 7 hours). ANOVA. Interaction: F= 19.6; p< 0.001; 1-β= 1.0. (*) higher than pre-training. ( # ) less than <7h and 7h post-training. (B) Push-Up pre- and post-training among groups. ANOVA. Interaction: F= 19.4; p< 0.001; 1-β= 1.0. (*) higher than pre-training. ( # ) less than 7 hours post-training. (C) Seated low-row pre- and post-training among groups. ANOVA. Interaction: F= 28.4; p< 0.001; 1-β= 1.0. (*) higher than pre-training. ( # ) less than <7h and 7h post-training. (D) Biceps curl pre- and post-training among groups. ANOVA. Interaction: F= 24.8; p< 0.001; 1-β= 1.0. (*) higher than pre-training. ( # ) less than <7h and 7h post-training.
