
Figure 2.
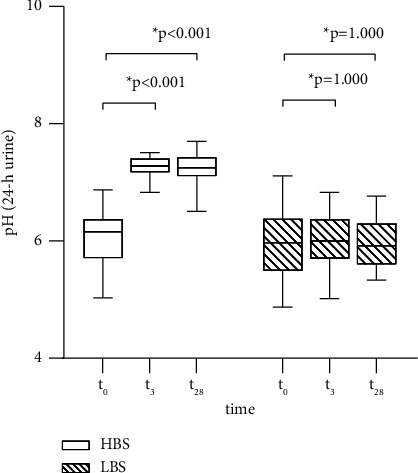
pH of 24-hour urine at the beginning of the study (t0), at the interim examination (t3), and at the end of the intervention (t28).
Official websites use .gov
A
.gov website belongs to an official
government organization in the United States.
Secure .gov websites use HTTPS
A lock (
) or https:// means you've safely
connected to the .gov website. Share sensitive
information only on official, secure websites.
pH of 24-hour urine at the beginning of the study (t0), at the interim examination (t3), and at the end of the intervention (t28).