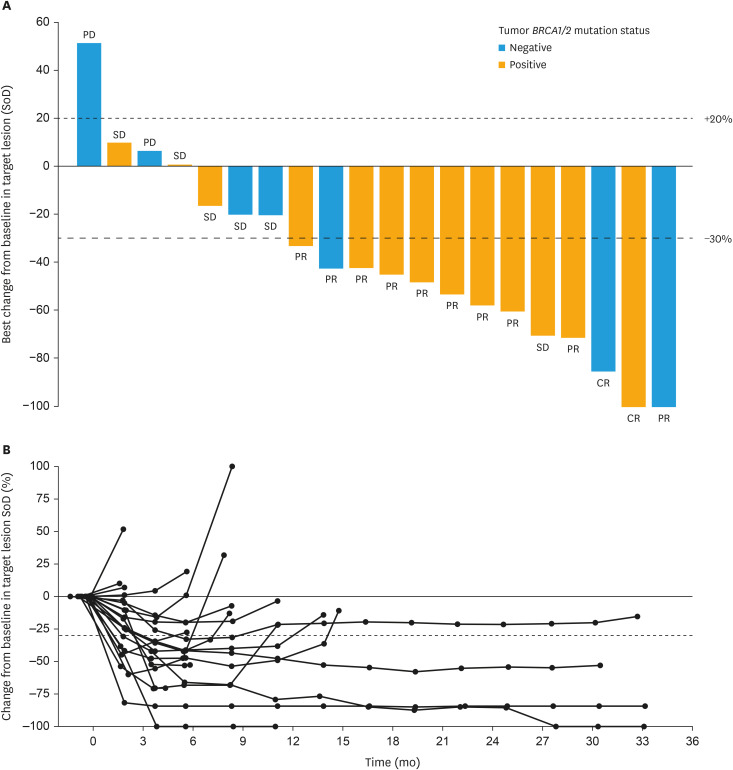
Fig. 1. Tumor responses. (A) Waterfall plot of ORR in the FAS. Includes all patients who had evaluable post-baseline target lesion(s). Tumor BRCA1/2 mutation status is dichotomized as ‘positive’ or ‘negative’ (includes ‘unknown’). The individual bars show the reduction rate at the time when the sum of the target lesion size decreased the most after starting administration of niraparib for each patient. The best overall response based on RECIST v1.1 shown at the end of each bar takes into account not only changes in the size of target lesions, but also evaluation of non-target lesions and the presence or absence of new lesions. (B) Change from baseline in target lesion size over time.
CR, complete response; FAS, full analysis set; ORR, objective response rate; PD, progressive disease; PR, partial response; RECIST, Response Evaluation Criteria in Solid Tumors; SD, stable disease; SoD, sum of diameters.

