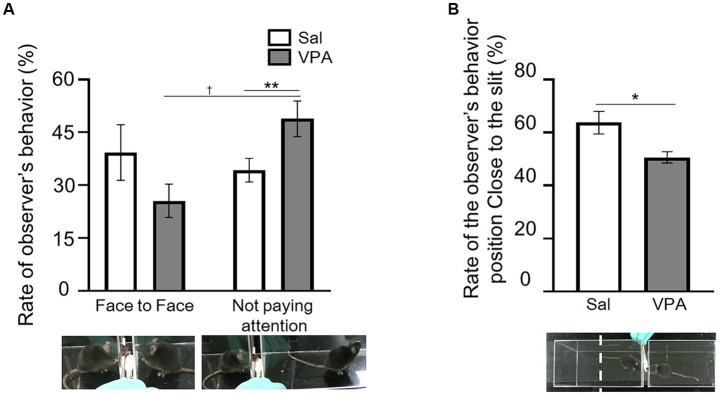
Figure 1.
Behavior during observation of reaching by partner. (A) Differences in the occurrence rate of “face-to-face” and “not paying attention” situations between the Sal and VPA groups. White bars represent data from the Sal group and gray bars represent data from the VPA group. Under the pictures are the sample of face-to-face and not paying attention. (B) Differences in the position of the observer in the observation room depending on whether the mouse in the observation room is from the Sal or VPA group. Error bars represent the standard error of the mean. **p < 0.01, *p < 0.05, †p < 0.10.

