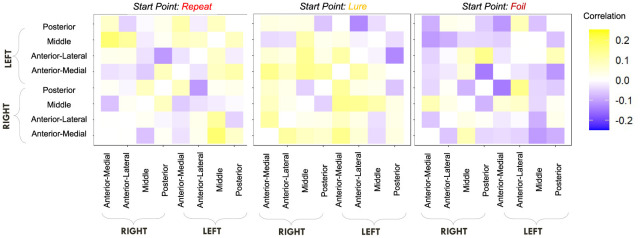
Figure 12.
E6: Start point—hippocampal RSFC correlations. We show a symmetric correlation matrix plot where each square represents the correlation between the row-column hippocampal resting state functional connectivity and the respective accumulator drift rate. We also see greater variability in the qualitative patterns in the start point—RSFC correlations (i.e., evidence of both negative and positive correlations), compared to drift rate—hippocampal RSFC.

