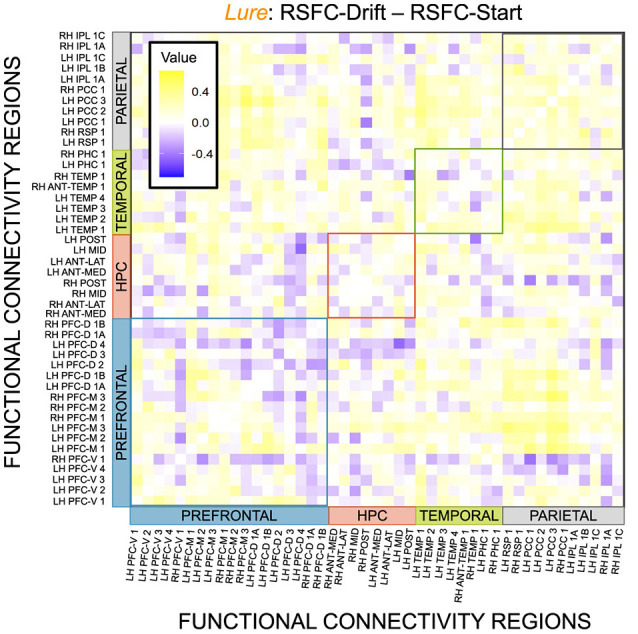
Figure 14.

E6: Correlation differences between RSFC and Drift Rate vs. RSFC and Start Point for Lure accumulator. We show a symmetric correlation matrix plot where each square represents the correlation between the row-column DMN resting state functional connectivity and the respective correlation difference between Drift Rate and Start Point.
