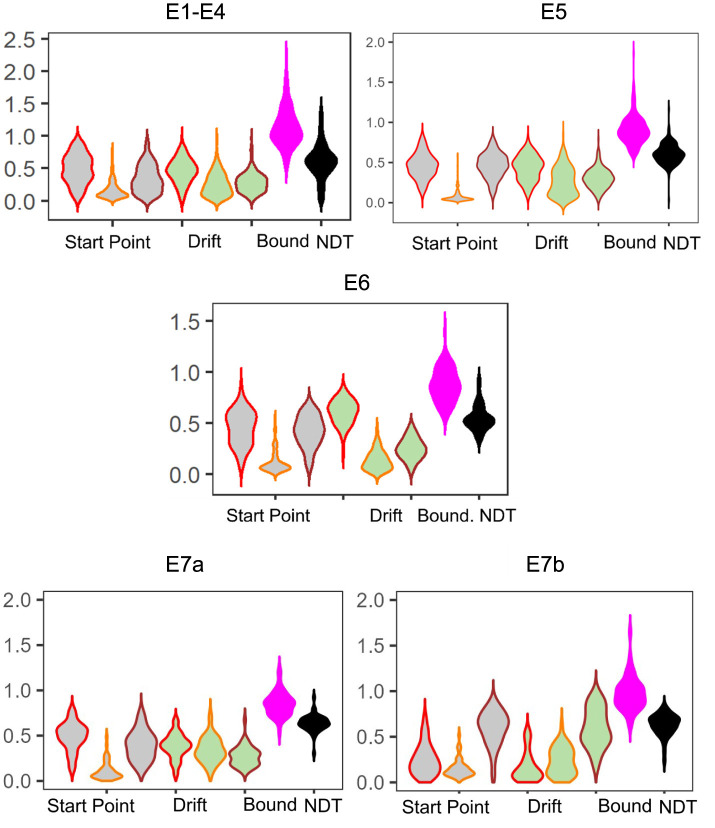
Figure 3.
Model posteriors for all experiments. We find overall that LBA posteriors follow qualitatively the same patterns across experiments. The left most three gray violins are the start point upper bound (color coded by response type: Repeat, Lure, and Foil). Next are the drift rates, similarly color coded. Finally, we have the boundary and non-decision time.

