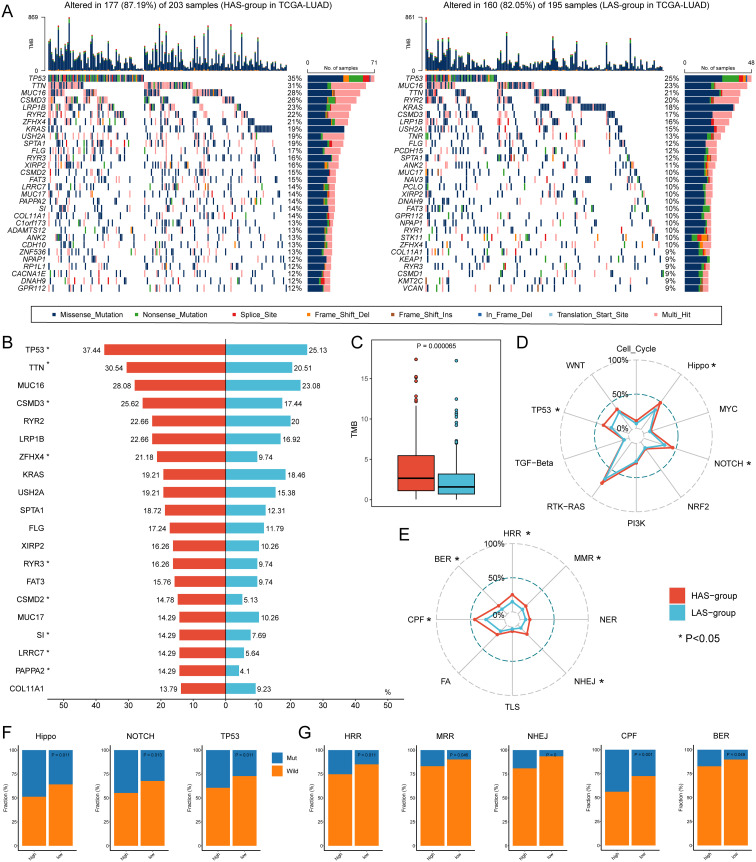
Figure 2.
Genomic alterations differences between the HAS and LAS group from the TCGA-LUAD cohort. (A) Genomic alterations landscape between the HAS (left) and LAS (right) group. (B) Mutation frequency differences of the top 20 mutation genes in the HAS group compared to the LAS group. The asterisk to the right of the gene indicates that the mutations in the gene were significantly different in the two groups, as determined by Fisher’s exact test. (C) The TMB between HAS and LAS groups. The HAS group had a higher TMB (2.66 (IQR: 0.04, 11.985) compared to the LAS group (1.58 (IQR: 0.02, 6.9)) with P value = 0.000065 compared by the Wilcoxon test. The frequency of mutated genes in each tumor-related pathway (D, F) and DDR pathway (E, G) difference between two groups. The asterisks in (D, E) denote significant differences of mutated genes in different pathways identified by Fisher’s exact test which showed in (F, G).

