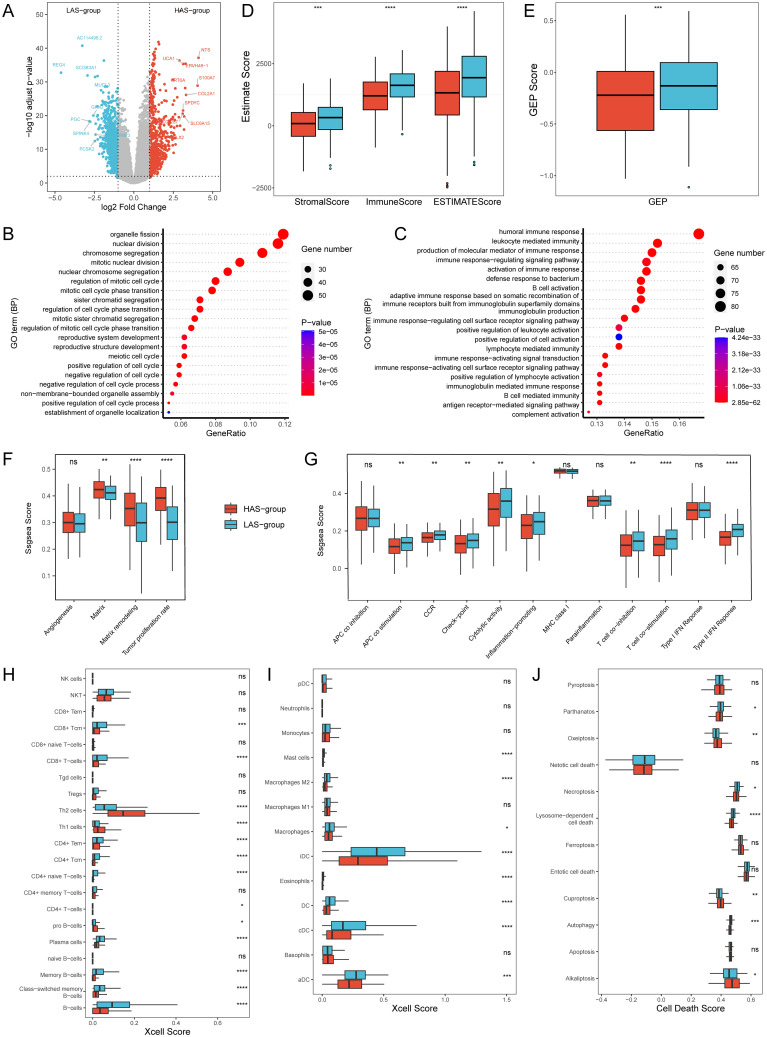
Figure 3.
Transcriptomic differences between the HAS and LAS group from the TCGA-LUAD cohort. (A) Volcano Plot of DEGs between the HAS and LAS group. (B, C) Top 20 biological processes of GO enrichment results between the HAS (B) and LAS (C) group. (D) Stromal score, immune score and ESTIMATE score between the two groups. (E) GEP score between the two groups. (F, G) Boxplots of gene sets related to tumor proliferation (F) and immune-related functions (G). (H, I) Box plot of T cells (H), B cells (H), and myeloid cells (I) infiltration in “Xcell” between the two groups. (J) Box plot of cell death between the two groups. "ns" indicates p > 0.05, * indicates p ≤ 0.05, ** indicates p ≤ 0.01, *** indicates p ≤ 0.001, and **** indicates p ≤ 0.0001. The actual P determined by the Wilcoxon test, and the medians (IQR) in Figures 2D-F were all displayed in Supplementary Table S4 . All abbreviations presented in Figure 3 showed as following: GEP, T cell-inflamed gene expression profile; CCR, cytokine and cytokine receptor; HLA, human leukocyte antigen; MHC, major histocompatibility complex.

