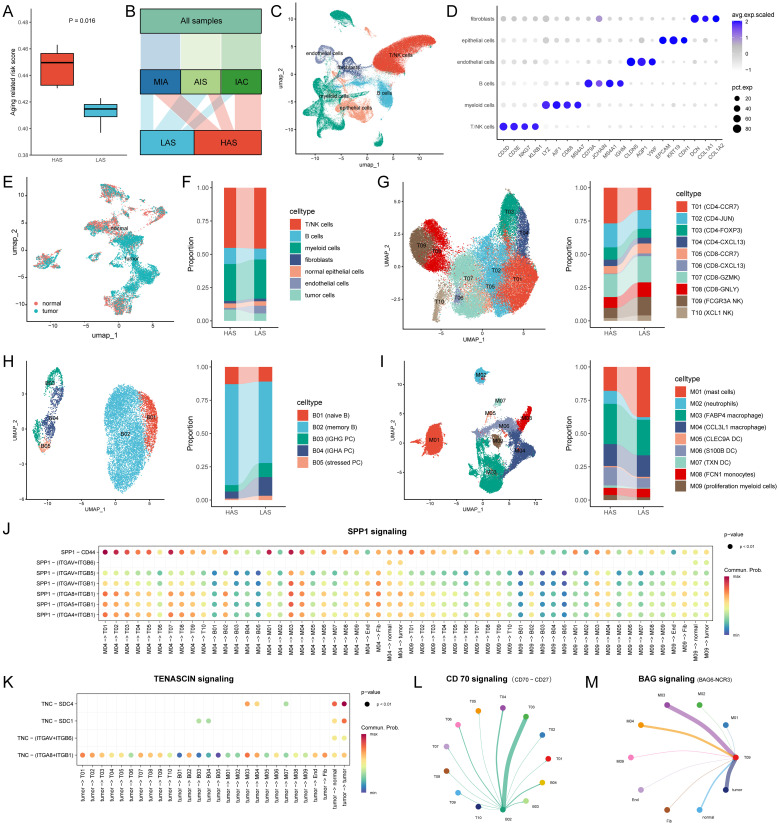
Figure 4.
Single cell atlas and cell-cell interactions between the HAS (n = 5) and LAS (n = 4) group. (A) ARRSs based on single cell pseudo-bulks differed between the HAS and LAS group. The HAS group had a higher ARRS 0.4496 (IQR: 0.4304, 0.463) compared to the LAS group 0.4147 (IQR: 0.3969, 0.4228) with P value = 0.0159 compared by the Wilcoxon test. (B) Alluvial diagram showed the grouping of the nine samples. (C) UMAP plot for cells displaying the six major cell types from patients. (D) Dot plot depicting mean expression levels and percentage of cells expressing signature genes across the six major cell types. (E) Distribution of normal and tumor cells in epithelial cells from LUAD. (F) The composition of the cell compartment, displaying the average frequencies of cell subsets for HAS and LSA groups. (G-I) The UMAP plot and the average frequencies of different T cell, B cell and myeloid cell subgroups. (J, K) Comparison of the significant ligand-receptor pairs of SPP1 signaling (J) and TENASCIN signaling (K) for the HAS group. Dot color reflects communication probabilities and dot size represents computed p-values. Empty space means the communication probability is zero. p-values are computed from one-sided permutation test. (L, M) Circle plot showed cell–cell communication mediated by CD70-CD27 (L) and BAG6-NCR3 (M) in the LAS group. All abbreviations presented in Figure 4 showed as following: ARRS, aging related risk score; IQR, interquartile range; AIS, lung adenocarcinoma in situ; MIA, minimally invasive adenocarcinoma; IAC, invasive adenocarcinoma; tumor, tumor cells; normal, normal epithelial cells; Fib, fibroblasts; End, endothelial cells.

