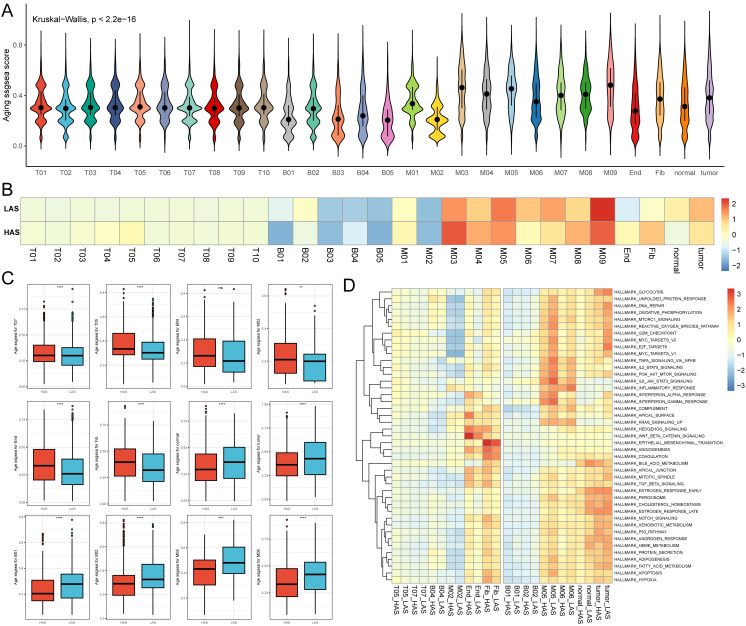
Figure 5.
Single cell age score. (A) The age score for each cell. (B) The medians of age scores for each cell type in the HAS and LAS groups. (C) The box plots demonstrating between-group differences in the HAS and LAS groups for age scores for specific cell types. We used the following notation for statistical significance: “ns” indicates p > 0.05, ** indicates p ≤ 0.01, *** indicates p ≤ 0.001, and **** indicates p ≤ 0.0001. The actual P determined by the Wilcoxon test, and the medians (IQR) in (C) were all displayed in Supplementary Table S4 . (D) Heatmap showed the activity of hallmarks between the HAS and the LAS groups for different cell types. All abbreviations presented in Figure 5 showed as following: tumor, tumor cells; normal, normal epithelial cells; Fib, fibroblasts; End, endothelial cells.

