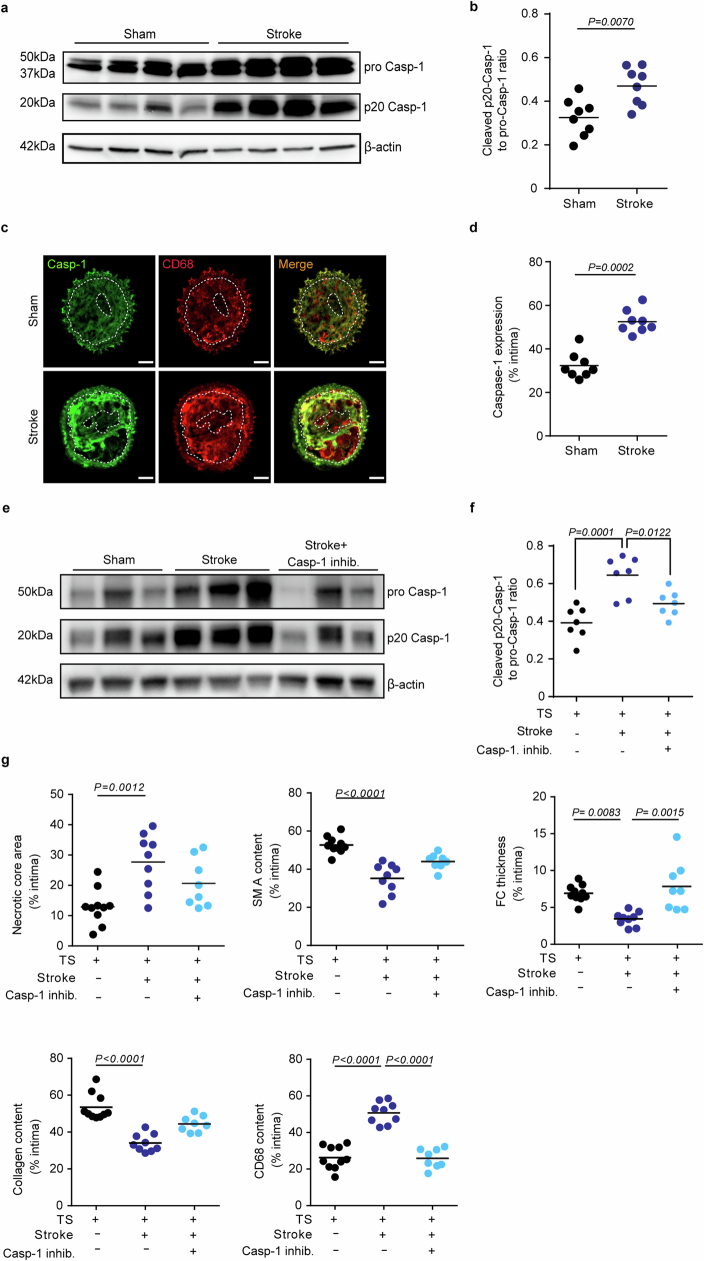
Extended Data Fig. 5. Stroke induces inhibitable inflammasome activation in atherosclerotic plaques.
a. Representative immunoblot of different cleavage forms of caspase-1 in CCA lysates with TS 1w after sham or stroke surgery. b. Quantification of cleaved caspase-1 (p20 Casp-1) as ratio to pro caspase-1 (ProCasp-1; U test, n = 8 per group). c. Representative immunofluorescence staining of caspase-1 (Casp-1) in CCA sections 1 w after sham or stroke surgery (scale bar = 50 µm). Images were segmented by thresholding to convert fluorescence signal into a binary image. Area between two white dotted lines represent intima. d. Caspase-1 expression was quantified as the percentage of total intima area (U test, n = 8 per group). e. Representative immunoblot image of the different cleavage forms of caspase-1 (Casp-1) in CCA lysates 1 w after sham, stroke control and stroke + caspase-1 inhibitor (VX 765) administration. f. Quantification of cleaved p20 Casp-1 intensity normalized to β-actin in CCA lysates (+TS) 1 w in the three treatment groups (black: sham; blue: stroke; light blue: stroke + VX765, ANOVA, n = 7 per group). g. Quantification of necrotic core area, SMA, Fibrous cap thickness, collagen and CD68 area 1w after sham or stroke in the respective treatment groups (performed as shown in Extended Data Fig. 3, ANOVA, n = 8–10 per group). Raw membrane images of all immunoblots can be found in Supplementary Fig. 1.

