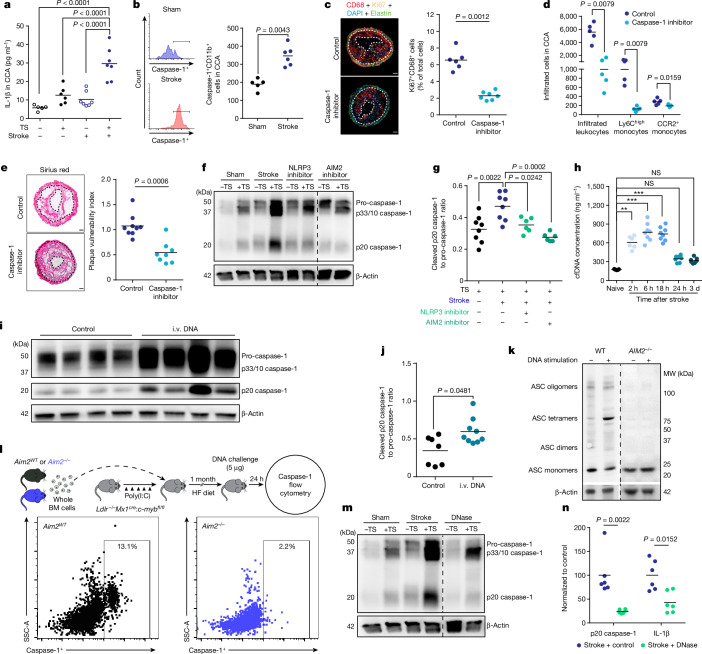
Fig. 2. Stroke induces double-stranded DNA-dependent inflammasome activation in atherosclerotic plaques.
a,b, IL-1β concentrations (K-test, n = 5–7 per group; a) and caspase-1 activity (FAM660 flow cytometry; b) in CCA 24 h after sham or stroke surgery (U-test, n = 5–6 per group). c,d, Analysis of macrophage proliferation normalized to total cell counts (right; U-test, n = 6–7 per group; c) and analysis of infiltrated leukocytes (d) in CCA sections of control-treated or caspase-1 inhibitor (VX765)-treated mice 7 days after stroke (K-test; n = 5 per group). Scale bars in c, 50 μm. e, Picro Sirius red stainings for stroke (left) and quantification of plaque vulnerability (right; U-test; n = 8–9 per group). Scale bars, 50 µm. f,g, Immunoblot for caspase-1 cleavage in CCA lysates 24 h after sham, stroke, stroke + NLRP3 inhibitor (MCC950) or AIM2 inhibitor (4-sulfonic calix[6]arene) administration (f) and corresponding immunoblot quantification (ANOVA; n = 8 per group; g). h, Total cfDNA serum concentrations at indicated timepoints after stroke and naive mice (K-test; n = 5–8 per group). NS, not significant. i,j, Immunoblot (i) and quantification (j) of cleaved p20 caspase-1 in CCA lysates from HCD-fed ApoE−/− mice with tandem stenosis surgery alone (control) or 24 h after i.v. DNA injection (U-test; n = 7–9 per group). k, Immunoblot for ASC oligomerization of WT or AIM2−/− macrophages after stimulation with DNA. MW, molecular weight. l, Experimental design of Aim2WT or Aim2−/− bone marrow (BM) transplantation to Ldlr−/−:Mx1cre:c-mybfl/fl mice receiving i.v. DNA (top) and flow cytometry histograms (bottom) of caspase-1 activity in bone marrow recipients 24 h after i.v. DNA. HF, high fat; SSC-A, side scatter area. m,n, Immunoblot (m) and quantification (n) of cleaved p20 caspase-1 in CCA lysates of HCD-fed ApoE−/− with tandem stenosis surgery receiving 1,000 U i.v. DNase immediately before stroke (U-test; n = 6 per group, shown as a ratio to the mean of the control group). Raw membrane images of all immunoblots are in Supplementary Fig. 1. a–e,g,h,j,n, Bars indicate the mean.

