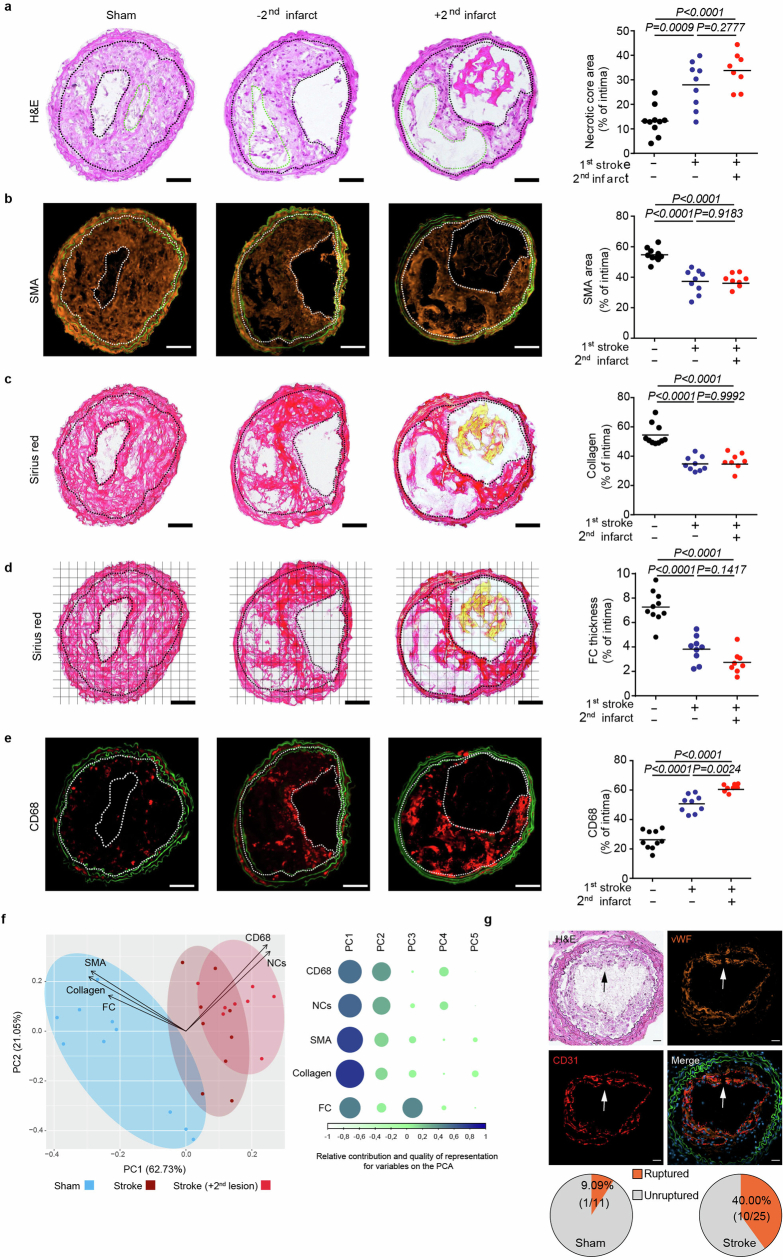
Extended Data Fig. 3. Stroke accelerates plaque destabilization and causes plaque rupture.
a. Representative microphotographs of CCA H&E staining. Area between two black dotted lines represents intima. Green dotted lines represent necrotic cores. Necrotic core area was quantified as the percentage of total intima area (ANOVA, n = 8–10 per group). b. Representative images of smooth muscle actin (SMA) immunofluorescence staining. SMA area was quantified as the percentage of total intima area (ANOVA, n = 8–10 per group). c. Representative microphotographs of Picro-Sirius red staining. Collagen area was quantified as the percentage of total intima area (ANOVA, n = 8–10 per group). d. Representative images of Picro-Sirus red stained CCA sections with the according grid for fibrous cap (FC) thickness quantification. FC thickness was quantified at the locations were the FC crossed the applied grid (ANOVA, n = 8–10 per group). e. Representative microphotographs of CD68 immunofluorescence staining. Images were segmented by thresholding to convert fluorescence signal into a binary image. CD68 area was quantified as the percentage of total intima area (ANOVA, n = 8–10 per group). f. Left: Principal component analysis (PCA) using CCA plaque vulnerability readouts from sham, stroke and stroke mice with detected secondary lesion found in a. to e. (n = 8–10 per group) Right: Contribution of the Plaque vulnerability readouts in principal component 1 to 5 (PC1 to PC5), weighted for their relative quality of representation in the PCA. g. Arrows indicate a disrupted fibrous cap in lesion. The pie charts illustrate the proportion of mice with ruptured CCA plaques 1 w after sham or stroke surgery (n = 11 or 25 mice per group)(all scale bars = 50 µm).

