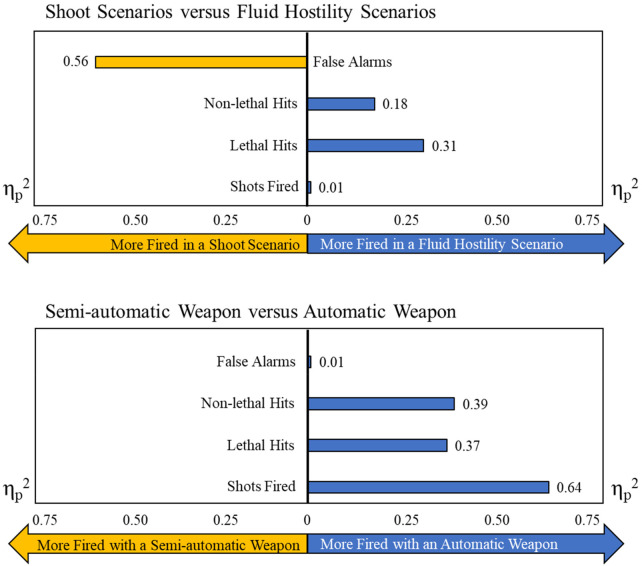
Figure 2.
Effect sizes (ηp2) as measured between the scenarios (top) and between weapon rates of fire (bottom). The measurement is depicted on the side with more instances of the event. For example, the top image depicts false alarms on the left side to represent that more false alarms were fired in a shoot scenario than in a fluid hostility scenario (ηp2 = 0.56).

