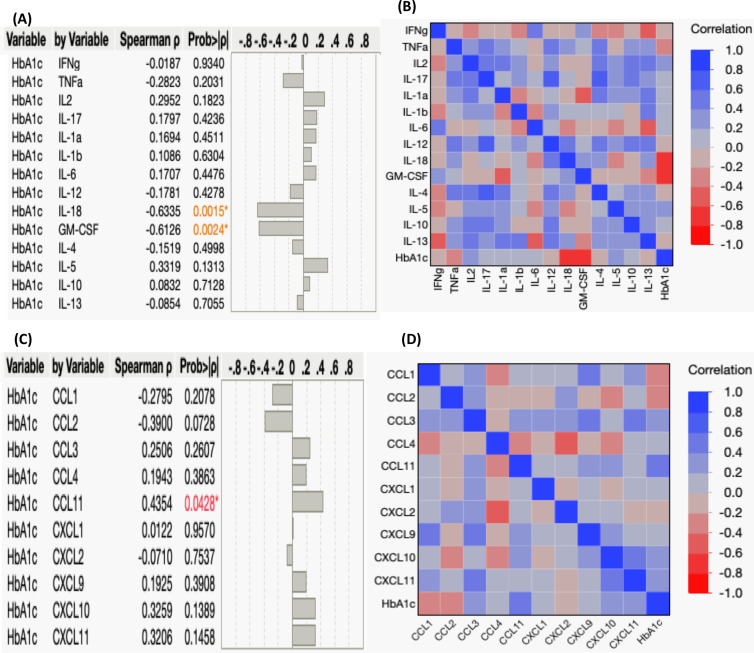
Figure 3.
Correlation between Systemic Cytokines, Chemokines, and HbA1c Levels in TB-PDM. (A) A multiparametric matrix correlation plot depicts the relationships between plasma cytokines (Type 1, Type 17, Type 2, regulatory, and other pro-inflammatory) and HbA1c levels in TB-PDM patients. (B) Spearman’s correlation coefficients are visualized, with blue indicating positive correlations and red indicating negative correlations. (C) A multiparametric matrix correlation plot depicting the relationships between plasma CC and CXC chemokines and HbA1c levels in TB-PDM patients. (D) Spearman’s correlation coefficients are visualized, with blue indicating positive correlations and red indicating negative correlations.

