Figure 3.
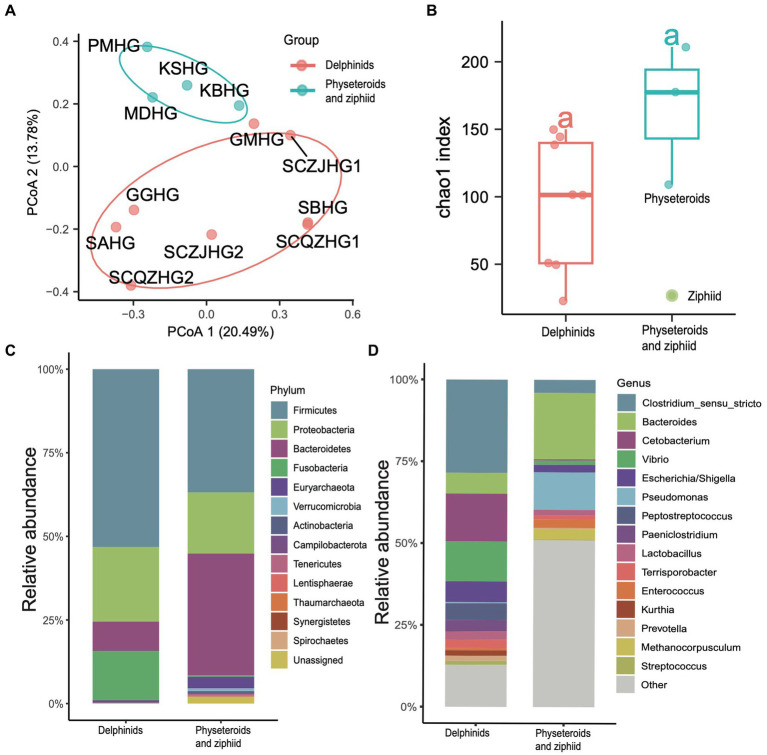
Gut microbiota composition differs among cetacean individuals. (A) PCoA of 12 hindgut samples at the ZOTU level based on Bray Curtis distances. (B) Boxplot showing the comparison of the α-diversity indices Chao1 index between the eight delphinid samples and four physeteroid and ziphiid samples. (C,D) The stacked bar chart shows the average prokaryotic relative abundance of hindgut samples at the phylum and genus level of the two cetacean lineages. (C) A comparison of the microbiota of delphinids, physeteroids, and ziphid and the phylum level. A total of 13 phyla were detected, while the unclassified taxa were named “Unassigned.” (D) A comparison of the microbiota of delphinids, physeteroids, and ziphid and the genus level. A total of 128 genera were detected, only the top 15 most abundant genera are shown here, and the remaining genera including unclassified taxa were grouped as “Other”.

