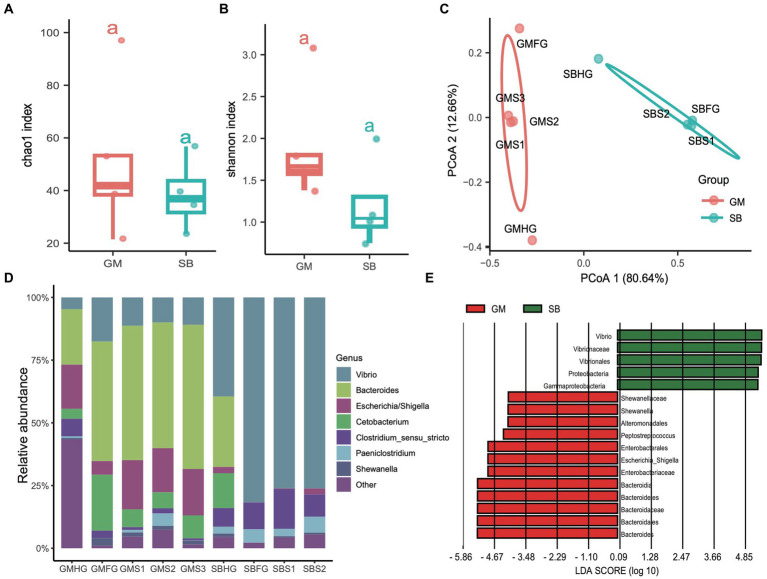
Figure 6.
Comparisons of the prokaryotic diversity and composition in the gastrointestinal tract of rough-toothed dolphin and short-finned pilot whales. (A,B) Boxplots showing the α-diversity indices comparisons, including Chao1 index (A) and Shannon index (B), of the gastrointestinal tract samples from rough-toothed dolphin (SB) and four from the short-finned pilot whale (GM). (C) PCoA based on the Bray Curtis distance to visualize the structure of prokaryotic communities in the stomach (GMS1, GMS2, and GMS3), foregut (GMFG), and hindgut (GMHG) of GM samples and stomach (SBS1 and SBS2), foregut (SBFG), and hindgut (SBHG) of SB samples. (D) Stacked bar chart showing the prokaryotic relative abundance in the stomach, foregut, and hindgut samples of GM and SB at the genus level. (E) Prokaryotic biomarkers significantly enriched in the GM and SB gastrointestinal tract samples determined by the linear discriminant analysis effect size (LEfSe) analysis.

