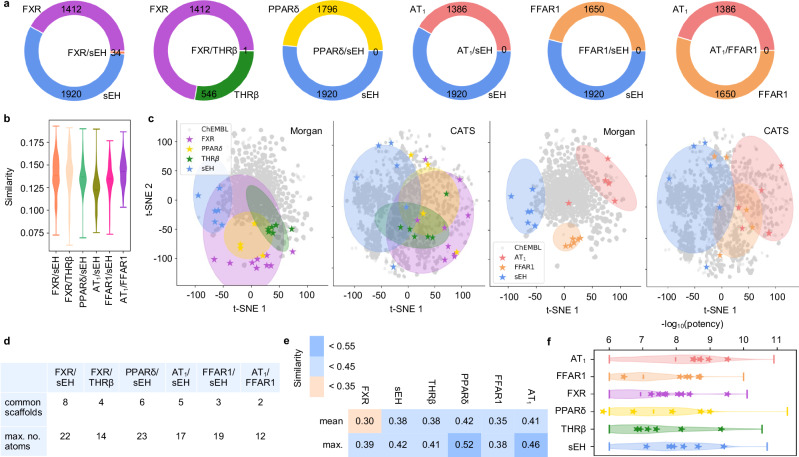
Fig. 2. Analysis of known ligands for targets of interest.
a Numbers of known ligands for the targets of interest (potency cutoff <100 µM) annotated in ChEMBL. Each plot represents a target pair of interest. b Violin plots of pairwise Tanimoto similarity distribution between ligands for the target pairs of interest. Numbers of ligands for FXR: 1412, sEH: 1920, PPARδ: 1796, THRβ: 546, AT1: 1386, FFAR1: 1650. c Relative distribution of known ligands for the six targets of interest (FXR, sEH, THRβ, PPARδ, AT1, FFAR1) illustrated as t-distributed stochastic neighbor embedding (t-SNE) (computed on Morgan fingerprints or Chemically Advanced Template Search (CATS) descriptors) with 10,000 random ChEMBL molecules as background. Known ligands of the target pairs FXR/sEH, FXR/THRβ and PPARδ/sEH populate proximal regions of the chemical space whereas AT1/sEH, FFAR1/sEH and AT1/FFAR1 modulators are more distant (modulators with potency ≤1 µM, shaded areas). The selected fine-tuning molecules are highlighted as stars. d Numbers of common scaffolds in the known ligands (potency cutoff <100 µM) of the target pairs annotated in ChEMBL and their max. number of atoms. e Mean and max. Tanimoto similarity of molecules selected for the fine-tuning sets for the targets of interest. f Violin plots of potency distribution of known ligands for the targets of interest. Compounds selected for fine-tuning are highlighted as stars. The lines represent the 1st and 3rd quartiles and the mean of the distribution. Numbers of ligands with potency ≤1 µM for FXR: 693, sEH: 1601, PPARδ: 1019, THRβ: 370, AT1: 1232, FFAR1: 1048. Source data are provided as a Source Data file.

