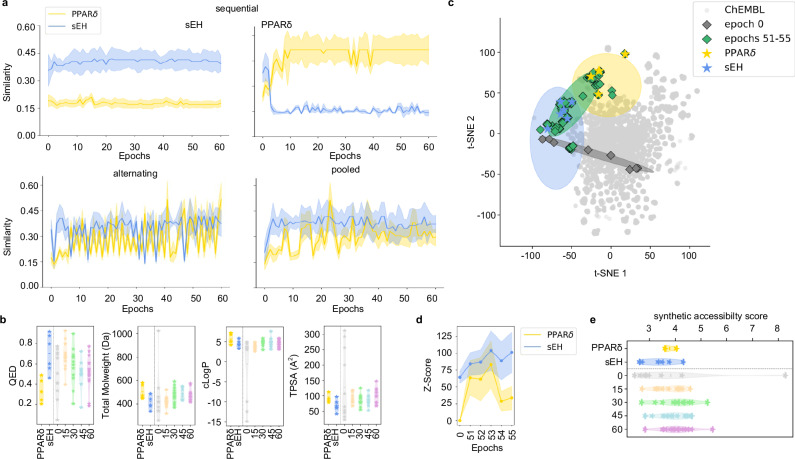
Fig. 3. Fine-tuning of chemical language models (CLM) for multi-target design.
The target pair PPARδ/sEH is shown as example in (a–e). a Effects of different CLM fine-tuning strategies on the similarity of beam search designs (width 50) to the fine-tuning molecules. Fine-tuning with pooled template sets was superior to sequential and alternating fine-tuning strategies in terms of design similarity to both fine-tuning collections. Graphs show the max. Tanimoto similarity ± SD (standard deviation of max. Tanimoto similarity) computed on Morgan fingerprints of the beam search designs per epoch to the fine-tuning molecules. For each epoch beam search designs (width 50) were generated and only valid SMILES were analyzed. b Quantitative estimation of drug-likeness (QED) scores38 and basic molecular features of beam search designs over the fine-tuning procedure (epochs 0, 15, 30, 45, 60) illustrated as violin plots. Stars represent the fine-tuning molecules and beam search designs, respectively. Numbers of analyzed ligands/designs PPARδ: 5, sEH: 6, epochs 0: 15, epoch 15: 23, epoch 30: 17, epoch 45: 10, epoch 60: 13 (only valid SMILES from beam search were analyzed). c Effects of pooled fine-tuning on design features (visualized as t-distributed stochastic neighbor embedding (t-SNE)). Top beam search designs from the epochs of highest similarity to both fine-tuning sets (51–55) in comparison to beam search designs from epoch 0 are shown. Numbers of analyzed ligands/designs PPARδ: 5, sEH: 6, epoch 0: 15, epochs 51–55: 249. d Target prediction (Z-scores) of designs from epochs 51–55 using the Similarity Ensemble Approach (SEA)39 for the targets of interest. Z-Scores are the mean ± standard deviation (SD). e Synthetic accessibility scores40 for the beam search designs obtained from different epochs during pooled fine-tuning visualized as violin plots. Fine-tuning molecules and beam search designs are highlighted as stars, respectively, and the middle line represents the mean of the distribution. Numbers of analyzed ligands/designs PPARδ: 5, sEH: 6, epochs 0: 15, epoch 15: 23, epoch 30: 17, epoch 45: 10, epoch 60: 13 (only valid SMILES from beam search were analyzed). Source data are provided as a Source Data file.

