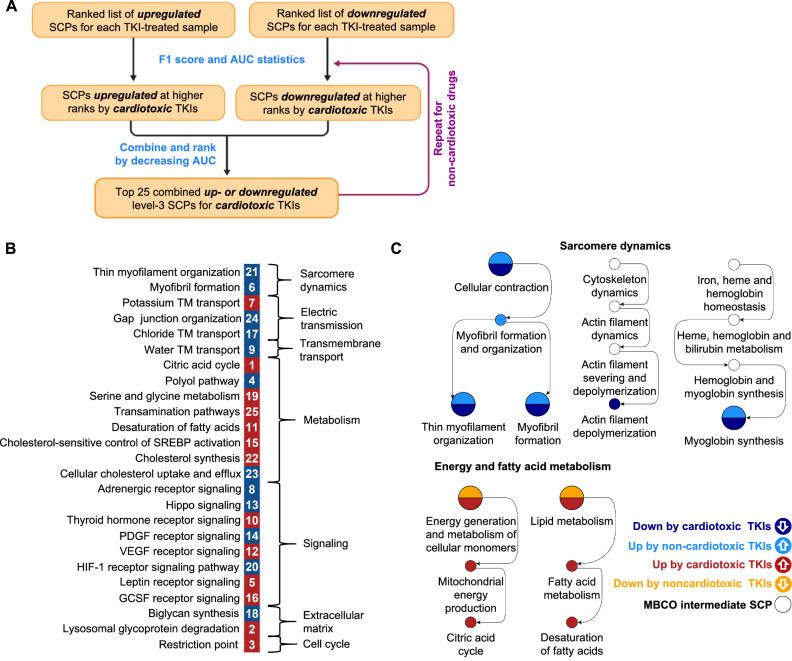
Fig. 2. Potential subcellular processes indicative of TKI-induced cardiotoxicity.
Up- and downregulated genes among the top 600 drug-selective gene expression profiles were subjected to pathway enrichment analysis using MBCO and Fisher’s Exact test. Significantly up- or downregulated SCPs (nominal p-value ≤ 0.05) were ranked separately by significance for each sample and SCP level. A To screen for SCPs that are selectively induced or repressed by cardiotoxic TKIs, we calculated how many cardiotoxic and non-cardiotoxic TKIs upregulate an SCP of interest in any cell line at any rank cutoff from 1 to 30. Definition of cardiotoxic TKIs as true positives allowed calculation of an F1 score (beta = 0.25) at each analyzed enrichment rank and quantification of the Area under the Curve (AUC). Similarly, we calculated F1 scores and an AUC by analyzing TKIs that downregulate the same SCP. To filter for mixed effects, we subtracted half of the other AUC from each AUC. SCPs were ranked by decreasing AUCs. Flow chart is used with permission from Mount Sinai Health System, licensed under CC BY. B Top up- (red) or downregulated (dark blue) 25 level-3 SCPs predicted for the cardiotoxic TKIs were grouped based on the higher-level functions. White numbers indicate AUC ranks. C The same analysis was applied to level-1, -2 and -3 SCPs, except that we only focused on the AUC obtained for enrichment ranks 1 to 20, due to a smaller number of SCPs within these levels. We also repeated the whole analysis, screening for SCPs selectively induced or repressed by non-cardiotoxic TKIs. Identified SCPs up- and downregulated for cardiotoxic (red and dark blue, respectively) and non-cardiotoxic TKIs (light blue and orange, respectively) for all levels were integrated into the MBCO hierarchy. Selected branches are shown. See Supplementary Fig. 19 for all predictions.

