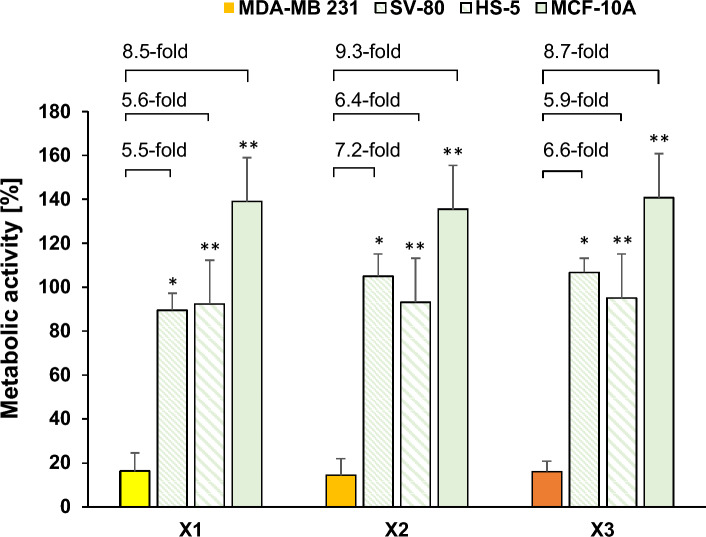
Fig. 6.
Metabolic activity of MDA-MB 231 cells incubated with X1–X3 (yellow to orange) versus non-cancerous SV-80 (green, diagonally downwards), HS-5 (green, diagonally far down) and MCF-10A cells (green, bold). Values were calculated as a mean of metabolic activity + SE after a 72 h exposure with X1–X3 at 2.5 µM (n = 4). The asterisks (*p < 0.05 and **p < 0.005 against the respective complex at 2.5 µM) represent statistical significance

