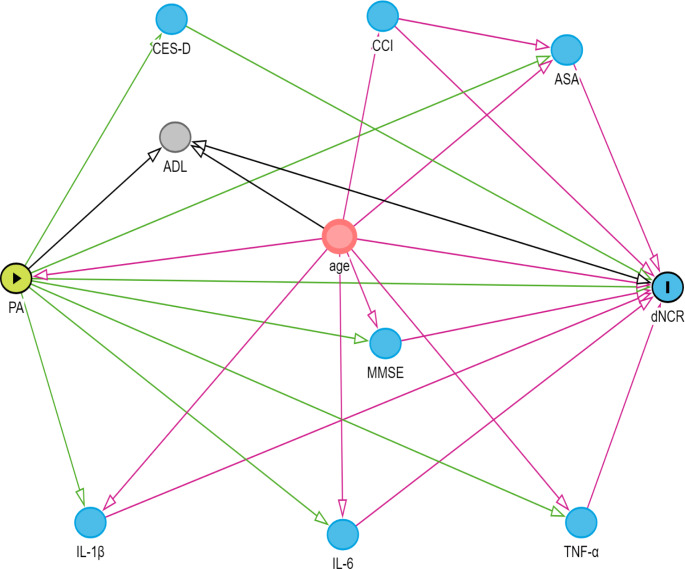
Fig. 1.
Directed Acyclic Graph (DAG)
Green circles represent exposures, blue circles represent outcomes, red circles represent common ancestors of exposure and outcomes (i.e. confounding factors), light blue circles represent ancestors of the outcome (i.e. causal determinants of the outcome), and brown circles represent other variables. Green lines depict causal pathways from exposure, while red lines indicate biased pathways to the outcome. Variables preceding arrows pointing to exposures or outcomes signify potential influencing factors, and variables linking exposures to outcomes may serve as mediating variables

