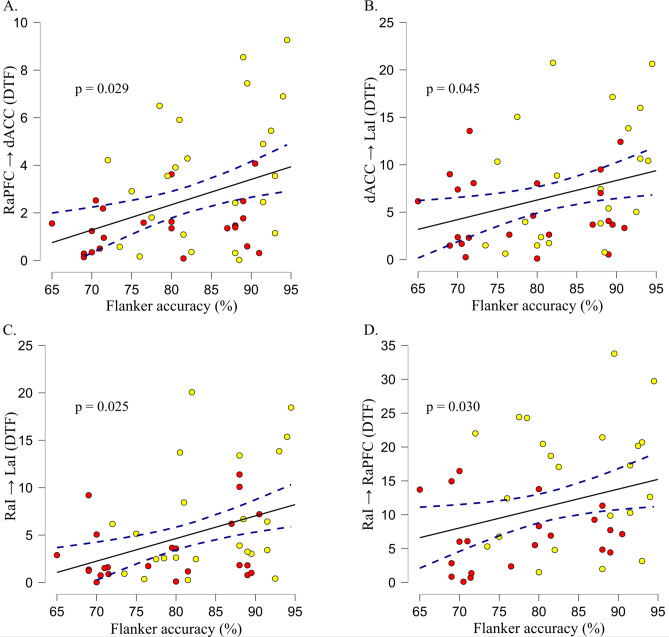
Figure3.
Brain-behavioral correlations. Scatterplots with regression lines are presented for the significant relationships between connectivity estimates and general flanker accuracy. Each plot delineates connections that exhibited differences across lower- and higher-fit children. Low-fit individuals are represented by red circles, while high-fit individuals are represented by yellow circles. Specifically, Panel( A) depicts the connectivity from the right anterior prefrontal cortex to the dorsal anterior cingulate cortex (RaPFC → dACC); Panel ( B)displays the connectivity from the dorsal anterior cingulate cortex to the left anterior insula (dACC → LaI). Panel ( C)showcases the connectivity from the right anterior insula to the left anterior insula (RaI → LaI). Panel ( D)demonstrates the connectivity from the right anterior insula to the right anterior prefrontal cortex (RaI → RaPFC).

