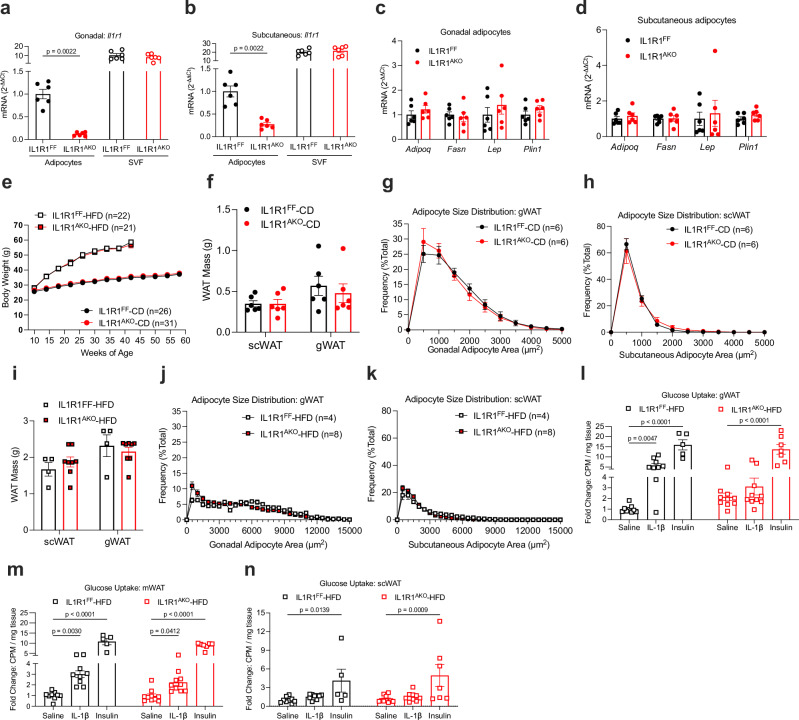
Fig. 1. IL1R1AKO mice have no metabolic phenotype.
a, b Relative mRNA expression in adipocytes and stromal vascular fraction (SVF) isolated from gWAT (a) and scWAT (b) of 12-week-old chow-diet-fed male mice (n = 6). c, d Relative mRNA expression in adipocytes isolated from gWAT (c) and scWAT (d) of 12-week-old chow-fed male mice (n = 6). e Body weight development of chow-fed (IL1R1FF n = 26; IL1R1AKO n = 31) and HFD-fed (IL1R1FF n = 22; IL1R1AKO n = 21) male mice. f–h Fat pad mass (f) and adipocyte size distribution in gWAT (g) and scWAT (h) of chow-fed 17-week-old male mice (n = 6). i–k Fat pad mass (i) and adipocyte size distribution in gWAT (j) and scWAT (k) of 17-week-old male mice HFD- fed for 9 weeks (IL1R1FF n = 4; IL1R1AKO n = 8). l–n In vivo glucose uptake in gWAT (l), mWAT (m), and scWAT (n) of 12-week-old male mice, HFD-fed for 4 days, treated with saline, IL-1β (1 μg/kg bw), or insulin (1U/kg bw). IL1R1FF: saline (n = 9), IL-1β (n = 9), insulin (n = 5); IL1R1AKO: saline (n = 9), IL-1β (n = 10), insulin (n = 7). Data are shown as fold change of counts per minute (CPM). n=biological replicates. Data are shown as individual measurements and mean ± SEM. Statistical analyses were performed by unpaired nonparametric two-tailed Mann-Whitney U test (a–d, f, i) or two-way ANOVA and Šidák’s (e, g, h, j, k) or Fisher’s LSD (l–n) multiple comparison test. Source data are provided as a Source Data File.

