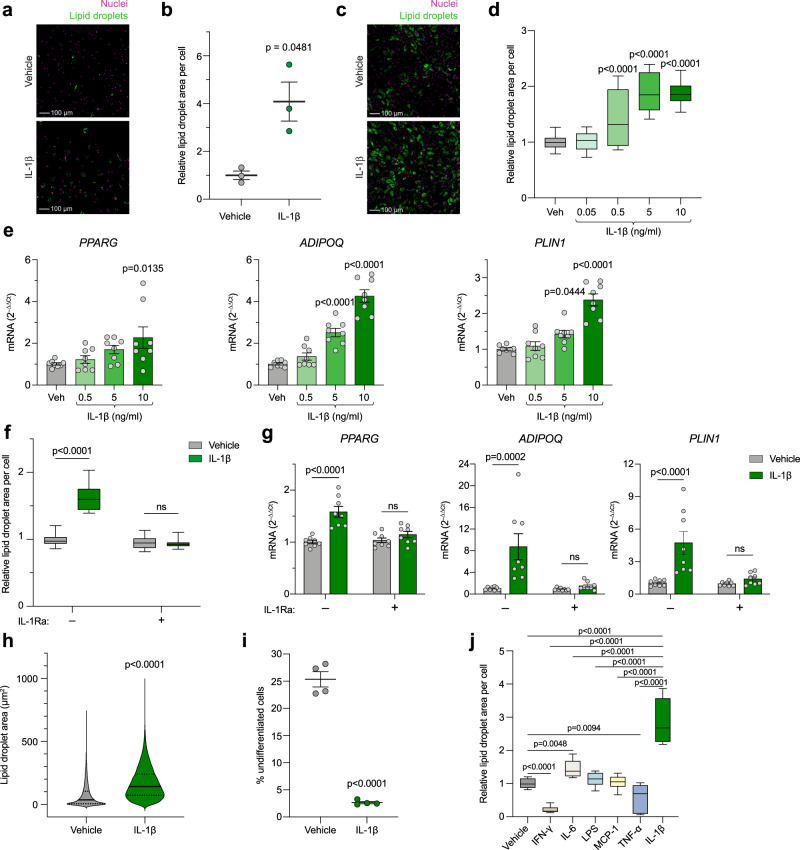
Fig. 4. IL-1β, but not other inflammatory factors, potently promotes adipogenesis in human adipocyte progenitors in vitro.
a, b Representative images (a) and quantification (b) of lipid droplet accumulation in freshly FACS-sorted scWAT-derived human primary adipocyte progenitors differentiated for 13 days with IL-1β (5 ng/ml) (n = 3 donors). Scale bar = 100 μm. c, d Representative images (c) and quantification (d) of lipid droplet accumulation in hASCs differentiated for 9 days with indicated concentrations of IL-1β (10 ng/ml in c) (n = 3 independent experiments with ≥ 4 replicates (34 datapoints for vehicle and 12 for the rest)). Scale bar = 100 μm. e Adipogenic gene expression on day 2 (PPARG) or 5 (ADIPOQ and PLIN1) of differentiation in hASCs treated with IL-1β from start of differentiation (n = 4 independent experiments with 2 replicates). f Lipid droplet accumulation in hASCs differentiated for 9 days with IL-1β (10 ng/ml) and IL-1Ra (500 ng/ml) (n = 4 independent experiments with ≥ 4 replicates (33 datapoints for –IL-1Ra +vehicle and 16 for the rest)). g Adipogenic gene expression in hASCs 2 days after adipogenic induction +/– IL-1β (10 ng/ml) and IL-1Ra (500 ng/ml) (n = 4 independent experiments with 2 replicates). h, i Single-cell resolution image analysis of lipid droplet area in individual cells (hASCs differentiated for 9 days with 10 ng/ml IL-1β). Distribution of total area covered by lipid droplets within individual cells (h) and % of undifferentiated cells (i) (n = 4 analyzed wells per condition, each well containing around 104 cells). j Lipid droplet accumulation in hASCs differentiated for 9 days with IFN-γ (10 ng/ml), IL-6 (10 ng/ml), LPS (100 ng/ml), MCP-1 (20 ng/ml), TNF-α (10 ng/ml), IL-1β (10 ng/ml), or vehicle (n = 3 independent experiments with ≥ 4 replicates (14 datapoints for vehicle and 12 for the rest)). Statistical analyses by paired (b) or unpaired (i) two-sided t test, one-way ANOVA and Dunnett’s multiple comparisons test compared to vehicle (d, e, j) or IL-1β (j), two-way ANOVA and Šidák’s multiple comparisons test (f, g), or Mann-Whitney test (h). Data are represented as individual measurements and mean ± SEM, box-and-whisker plots (line inside box = median; box limits = first and third quartiles; whisker ends = minima and maxima), or violin plots. Source data are provided as a Source Data File.

