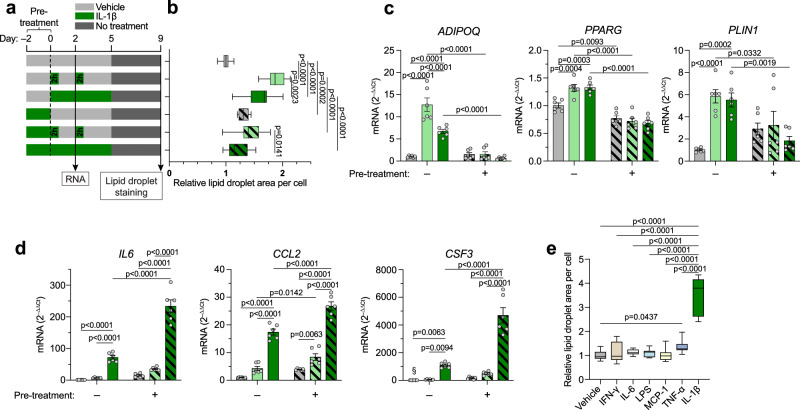
Fig. 6. Distinct effects of acute and chronic IL-1β exposure on adipogenic and inflammatory response.
a Schematic of treatments in experiments shown in (b–d). b Lipid droplet accumulation in hASCs treated as shown in (a) (n = 3 independent experiments with 4 replicates (12 datapoints per condition)). c, d Expression of adipogenic (c) and pro-inflammatory (d) genes in hASCs treated as shown in (a). Conditions are color/pattern coded as in (b) (n = 3 independent experiments with 2 replicates). e Lipid droplet accumulation on day 9 of differentiation in hASCs exposed to IFN-γ (10 ng/ml), IL-6 (10 ng/ml), LPS (100 ng/ml), MCP-1 (20 ng/ml), TNF-α (10 ng/ml), IL-1β, or vehicle for 2 h on day 0 and day 2 (n = 3 independent experiments with ≥ 4 replicates (14 datapoints for vehicle and 12 for the rest)). Statistical analyses by two-way ANOVA and Tukey’s and Šidák’s multiple comparisons tests (b–d) or one-way ANOVA and Dunnett’s multiple comparisons tests compared to vehicle or to IL-1β (e). IL-1β: 10 ng/ml in all panels. Data are represented as box-and-whisker plots (line inside box = median; box limits = first and third quartiles; whisker ends = minima and maxima) or individual measurements and mean ± SEM. Source data are provided as a Source Data File.

