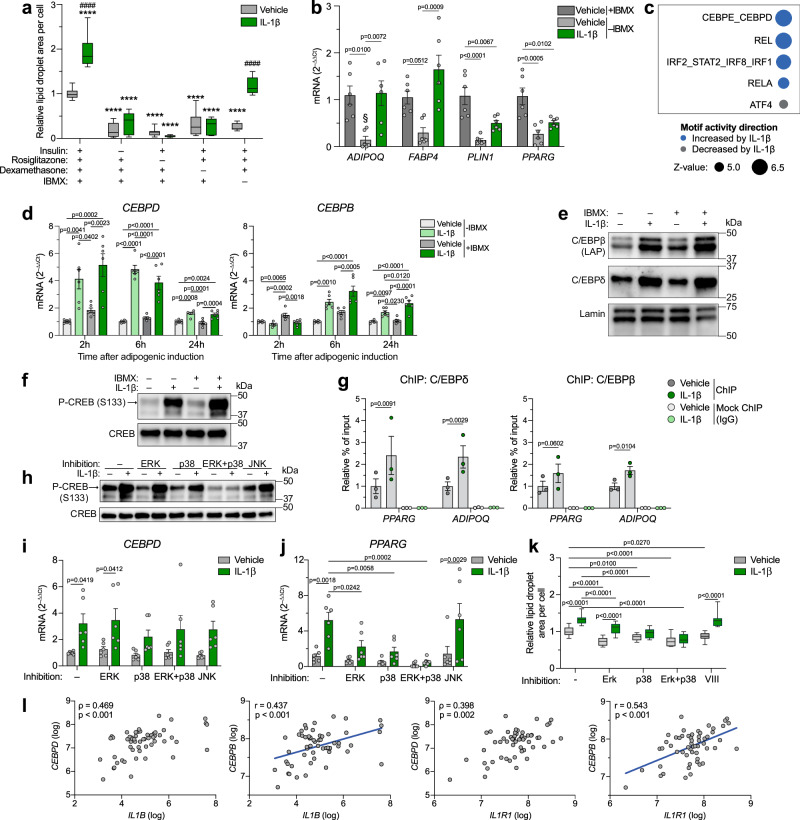
Fig. 7. IL-1β increases expression of C/EBPδ and C/EBPβ and their subsequent binding near adipogenic genes.
a Lipid droplet accumulation in hASCs differentiated for 9 days in complete (n = 18 datapoints) or suboptimal (n = 12 datapoints) adipogenic cocktail and +/– IL-1β for the first five days (n = 3 independent experiments with ≥ 4 replicates). b Adipogenic gene expression in hASCs 2 days after adipogenic induction +/– IBMX and IL-1β (n = 3 independent experiments with 2 replicates). § denotes conditions with undetectable mRNA levels in all/some samples. c Top 5 predicted IL-1β-regulated motifs in hASCs 2 days after adipogenic induction +/– IL-1β, analyzed by ISMARA (n = 4 independent experiments). d Gene expression at indicated time points after adipogenic induction +/– IBMX and IL-1β (n = 3 independent experiments with 2 replicates). e, f Western blot on protein collected 24 h (e) or 30 min (f) after adipogenic induction +/– IBMX and IL-1β (one representative blot from 3 independent experiments). g ChIP-qPCR of hASCs 20 h after adipogenic induction +/– IL-1β (n = 3 independent experiments). Data shown as % of input normalized to vehicle in the C/EBPδ- or C/EBPβ-pulldown. h Western blot on protein collected 30 min after adipogenic induction with IL-1β and indicated inhibitor(s) (one representative blot from 3 independent experiments). i–k Gene expression (i, j) and lipid droplet accumulation (k) in hASCs after 2 h (i), 24 h (j) and 9 days (k) of differentiation +/– IL-1β for the first 2 h and indicated inhibitor(s) for the first 2 (i) or 24 (j, k) h (n = 3 independent experiments with 2 (i, j) or ≥ 4 (k) replicates (k: 18 datapoints for inhibitor-free conditions and 12 for the rest)). l Pearson (r coefficient) or Spearman (ρ coefficient) correlations between scWAT mRNA levels of IL1B/IL1R1 and CEBPD/CEBPB in a clinical cohort (n = 56). Two-tailed p-values. IL-1β: 10 ng/ml in all panels. Statistical analyses by two-way ANOVA and Dunnett’s (****p < 0.0001 in a) or Šidák’s (####p < 0.0001 in a) multiple comparisons test against vehicle of complete adipogenic cocktail or within each adipogenic cocktail condition, respectively (a), and against matched treatment (vehicle or IL-1β) without inhibitor or within each inhibitor condition, respectively (i-k), one-way ANOVA and Tukey’s multiple comparisons test (b, d), or two-sided ratio paired t test (g). Data are represented as box-and-whisker plots (line inside box = median; box limits = first and third quartiles; whisker ends = minima and maxima) or individual measurements and mean ± SEM. Source data are provided as a Source Data File.

