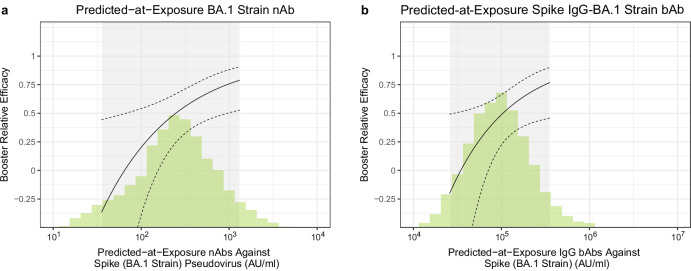
Fig. 3. Correlate of booster relative efficacy curves against Omicron COVID-19 among SARS-CoV-2 naive participants (N = 2464) as a function of predicted-at-exposure immune marker level.
a Neutralizing antibody (nAb) titer against Spike (BA.1 strain) pseudovirus; (b) IgG binding antibody (bAb) concentration against Spike (BA.1 strain). The curves show the relative efficacy of three-dose mRNA-1273 vs. two-dose mRNA-1273. The dashed black lines are 95% confidence intervals. The green histograms are an estimate of the density of predicted-at-exposure antibody marker level in per-protocol boosted SARS-CoV-2 naive participants. The gray shadings indicate the middle 90% (5th percentile to 95th percentile) of this marker distribution.

