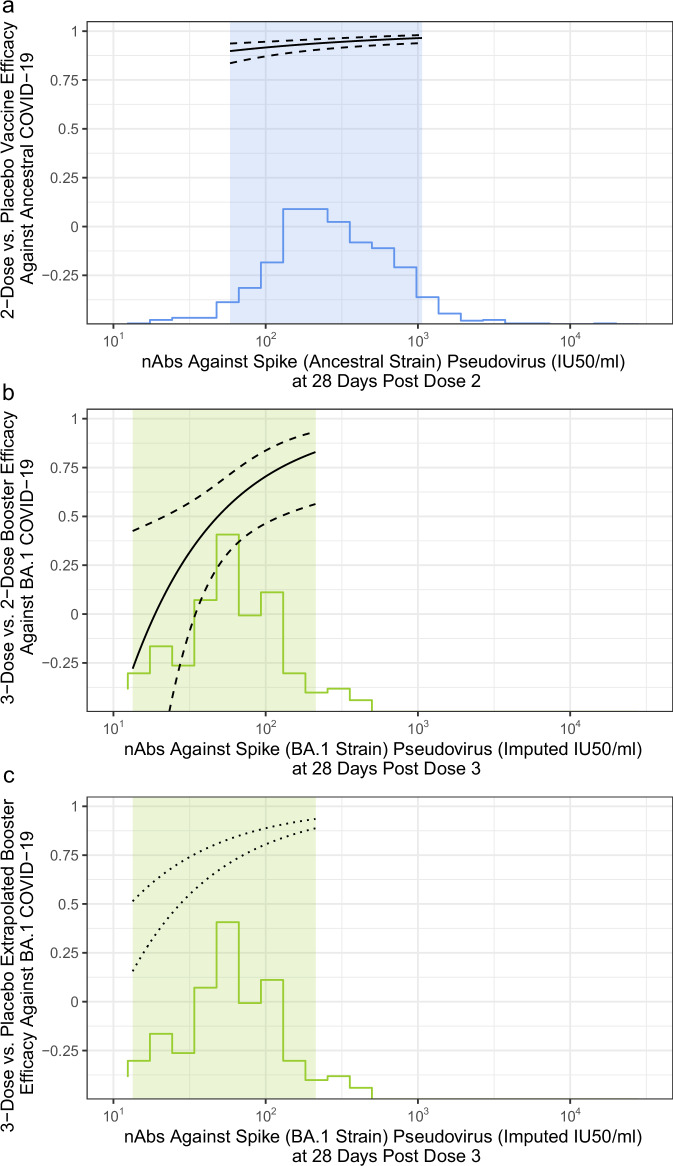
Fig. 4. Matched neutralizing antibody, COVID-19 vaccine efficacy curves for Ancestral and Omicron eras.
The curves show vaccine efficacy among SARS-CoV-2 naive participants (a, N = 1615; b, c, N = 2464). a The solid curve graphs two-dose vs. placebo vaccine efficacy against Ancestral COVID-19 by D57 (28 days post dose 2) Ancestral strain neutralizing antibody (nAb) titer in International Units (IU50/ml). The blue histogram shows the distribution of post dose 2 Ancestral nAb titer. The light blue shading indicates the middle 90% (5th percentile to 95th percentile) of the marker distribution. b The solid curve graphs three-dose vs. two-dose booster relative efficacy against Omicron COVID-19 by BD29 (28 days post dose 3) BA.1 nAb titer in imputed IU50/ml (see Methods). In (a) and (b), solid lines are point estimates and dashed lines are 95% confidence intervals. c The two dashed lines are the most and least conservative estimates of extrapolated booster vaccine efficacy against Omicron (BA.1) COVID-19 by BD29 (28 days post dose 3) BA.1 nAb titer in imputed IU50/ml for a 3-dose group vs an unvaccinated group. The curves are based on inferring an unvaccinated group using observational cohort data reported in eTable 2 in ref. 23, namely that by 13 months post dose 2, VE (versus an unvaccinated control) against infection and hospitalization waned to 34% and 62%, respectively. In (b) and (c), the green histogram shows the distribution of post dose 3 BA.1 nAb titer. The light green shadings indicate the middle 90% (5th percentile to 95th percentile) of the marker distribution.

