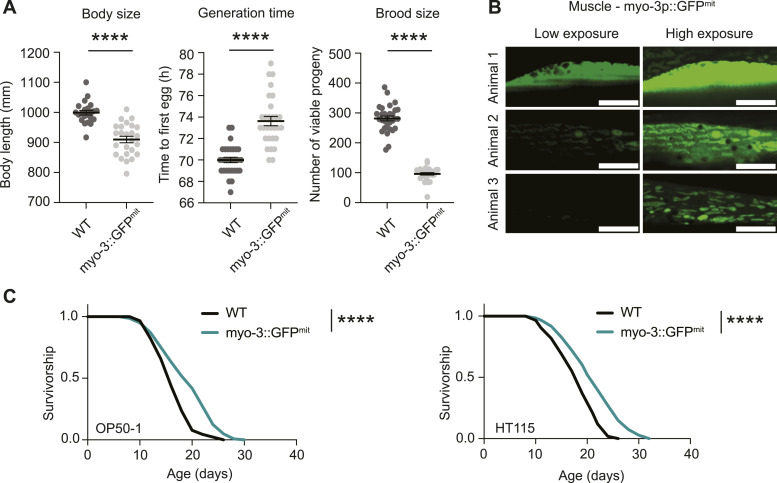
Figure 1. Limitations of current mitochondrial imaging tools in C. elegans.
(A) Healthspan analysis of the myo-3::GFPmit strain compared with WT N2 worms, showing body size (left graph), generation time (middle), and brood size (right). Body size measurements were performed with 20–25 individual worms. Generation time and brood size measurements were performed with 30 worms pooled from two independent experimental repeats. All values are presented as mean ± SEM. ****P < 0.0001 versus the respective WT group (nonparametric Kruskal–Wallis’s test). (B) Representative fluorescence pictures depicting mitochondrial networks in the body wall muscle of three different worms on day 2 of adulthood. The upper panel displays a muscle cell with a predominantly cytosolic GFP signal from myo-3p::GFPmit, whereas the middle and bottom panels show a gradual labeling of mitochondria by GFP. For comparison, the left images are in low exposure, whereas the right images are in high exposure. Scale bar: 10 μm. (C) Survival curve of the myo-3::GFPmit strain compared with WT in OP50-1 (left lifespan) and HT115 (right lifespan) bacteria. ****P < 0.0001 indicating significant difference compared with WT animals by one-way ANOVA with Tukey’s multiple comparisons test.

