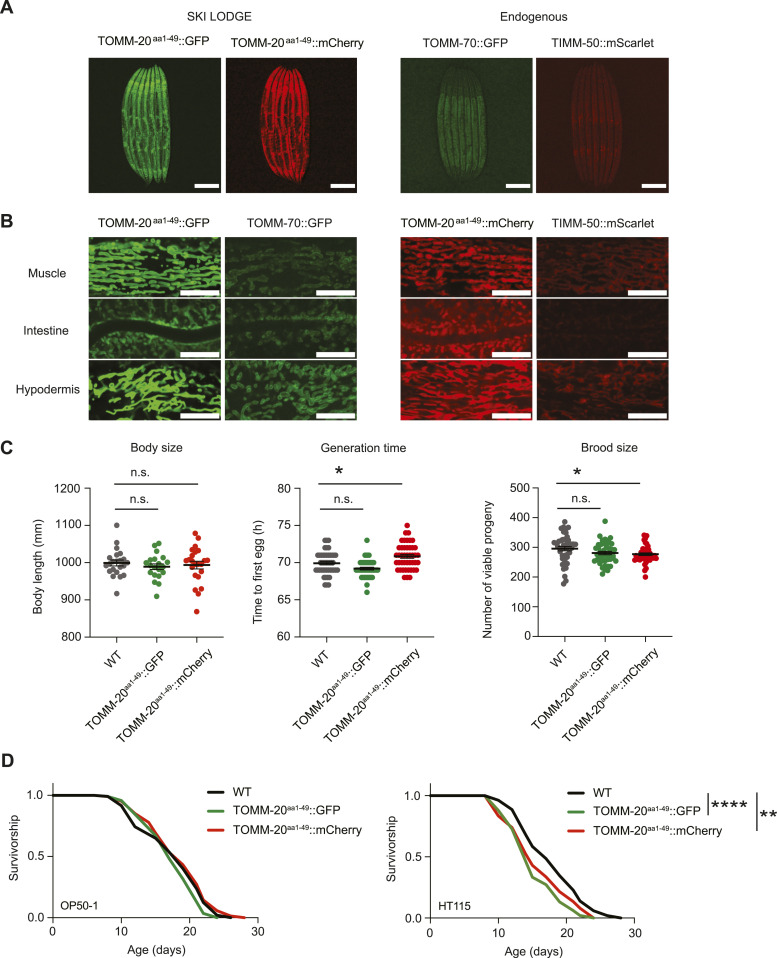
Figure 3. Novel TOMM-20 reporter strains generated using SKI LODGE in C. elegans.
(A) Fluorescence images of the SKI LODGE TOMM-20aa1-49::GFP and TOMM-20aa1–49::mCherry worms, respectively, as well as the TOMM-70::GFP and TIMM-50::mScarlet worms at day 1 of adulthood. Laser exposure: 65 ms. Scale bar: 200 μm. (A, B) Fluorescence images of the tissues from the strains in (A) at day 1 of adulthood. Laser exposure and brightness/contrast were kept constant for comparison of fluorophore intensity in all tissues. Scale bar: 10 μm. (C) Healthspan analysis of SKI LODGE strains compared with WT N2, showing body size (left), generation time (middle), and brood size (right). Body size measurements were performed with 25 individual worms. Generation time and brood size measurements were performed with 45 worms pooled from three independent experimental repeats. All values are presented as mean ± SEM. *P < 0.05 (nonparametric Kruskal–Wallis’s test). (D) Survival of SKI LODGE strains compared with WT in OP50-1 (left lifespan) and HT115 (right lifespan) bacteria. **P < 0.01 indicating significant difference between WT animals and TOMM-20aa1–49::mCherry worms, ****P < 0.0001 represents significant difference between WT and TOMM-20aa1–49::GFP worms by one-way ANOVA with Tukey’s multiple comparisons test. See Table S3 for detailed lifespan statistics.

