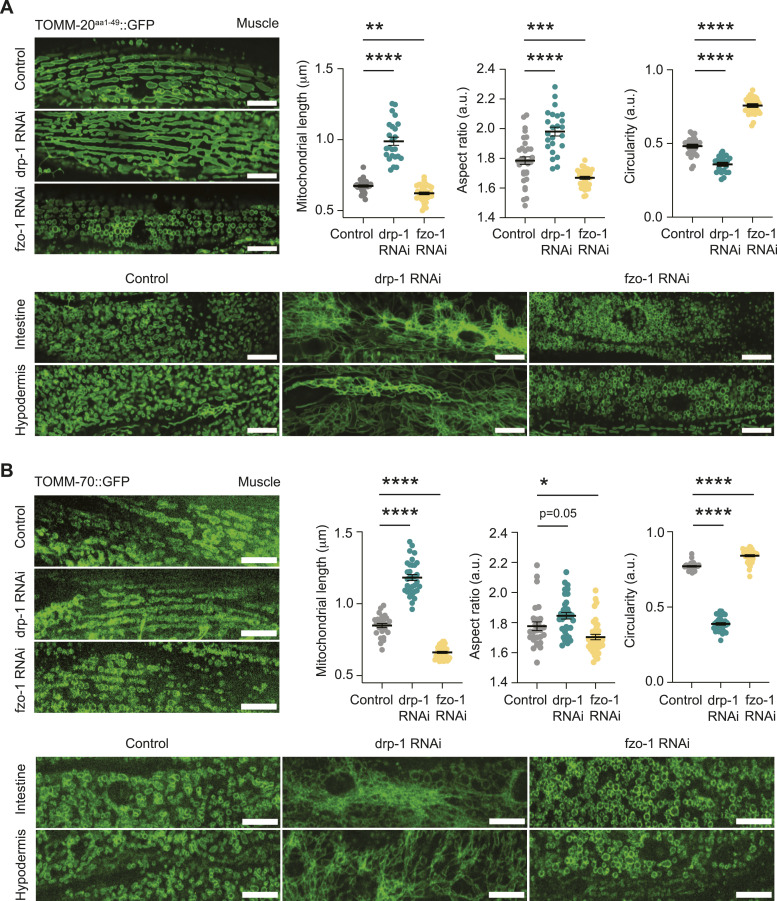
Figure 5. Analysis of mitochondrial dynamics in C. elegans tissues.
(A) Fluorescence images of tissues from SKI LODGE TOMM-20aa1–49::GFP worms on day 2 of adulthood after treatment from hatch with control (empty vector), DRP-1, or FZO-1 RNAi in OP50 bacteria, respectively. The images display the body wall muscle along with the corresponding quantification of changes in mitochondrial dynamics, including mitochondrial length, aspect ratio, and circularity, quantified using MitoMAPR. In addition, images of intestine and hypodermis tissues treated with the corresponding RNAis are shown. Scale bar: 10 μm. For the quantification of mitochondrial shapes, all values are presented as mean ± SEM. **P < 0.01, ***P < 0.001 ****P < 0.0001 indicated versus the control group (nonparametric Kruskal–Wallis’s test). (A, B) Fluorescence images of tissues from endogenous TOMM-70::GFP worms following the same conditions and analyses as described in (A). Scale bar: 10 μm. For the quantification of mitochondrial shapes, all values are presented as mean ± SEM. *P < 0.05, ****P < 0.0001 indicated versus the control group (nonparametric Kruskal–Wallis’s test).

