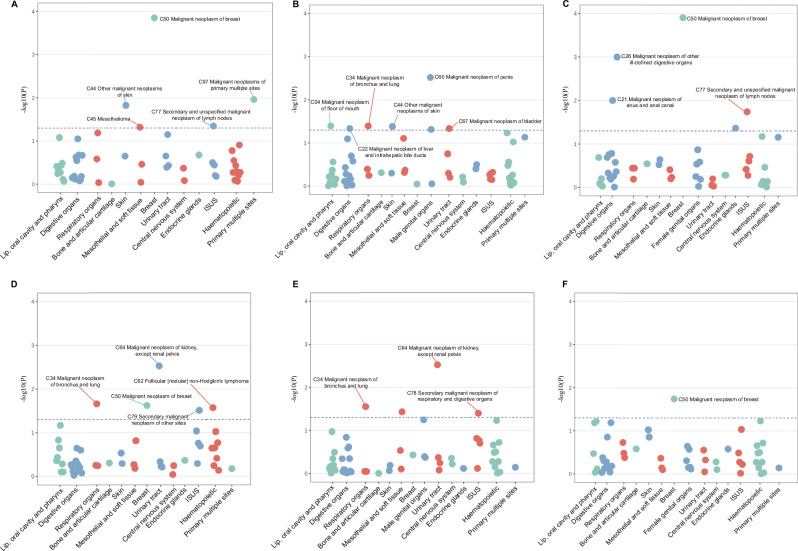
Fig. 2. Manhattan plot of phenome-wide association studies.
A–C The adjusted p value (−log10(p value)) from multi-variable Cox regression models for site-specific cancers, according to psoriasis in all participants (A), male participants (B), and female participants (C). D–F The adjusted p value (−log10(p value)) from multi-variable logistic regression models for site-specific cancers, according to the PRSs for psoriasis in all participants (D), male participants (E) and female participants (F). Dots represent site-specific cancers, grouped into systemic categories denoted by different colors. The horizontal hatched line indicates the statistical significance (p < 0.05). All statistical tests are two-sided and unadjusted for multiple comparisons. ISUS ill-defined, secondary, unspecified sites. Source data are provided as a Source Data file.

