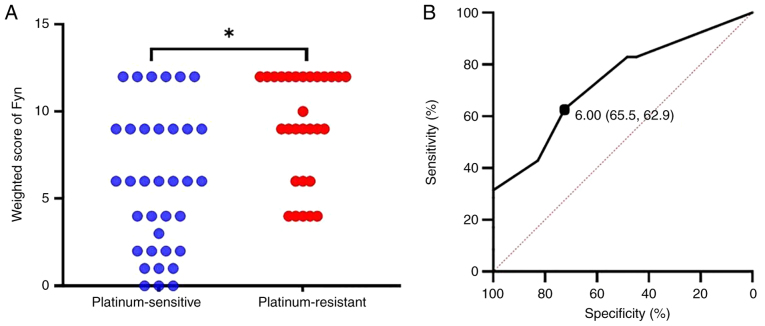
Figure 2.
Comparison of Fyn weighted scores between platinum-sensitive and platinum-resistant groups, and ROC curve analysis for predicting platinum sensitivity. (A) Comparison of Fyn weighted scores showed significantly lower scores in the platinum-sensitive group compared to the platinum-resistant group. (B) ROC curve analysis using Fyn weighted scores revealed a cutoff value of 6 for predicting platinum sensitivity, with a sensitivity of 62.9% and specificity of 65.5%. The AUC is 0.733, with a 95% confidence interval of 0.614–0.852. *P<0.01. ROC, Receiver Operating Characteristic; AUC, area under the curve.

