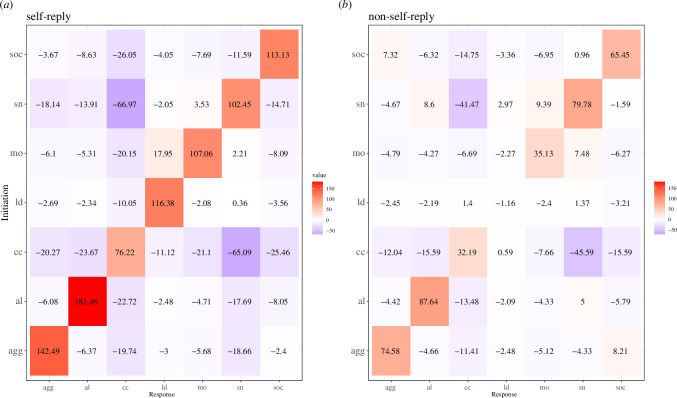
Figure 1.
Transition matrices for ( a ) self-reply call pairs (in which two sequential calls were emitted by the same individual) and ( b ) non-self-reply call pairs (in which sequential calls were emitted by different individuals). The values in the tiles represent the relative association between initiation call type ( x ) and the response call type ( y ) while accounting for the total number of transitions with initiation call type ( x ). The colours denote over- (orange) or under- (purple) representation of each call pair combination. The values correspond to p estimation significance levels (i.e. pbin > 3: p < 0.001; > 2: p < 0.01; > 1.3: p < 0.05; if < 1.3: NS). The script was adapted from Gries [52].

